Data Interpretation Questions Practice Question and Answer
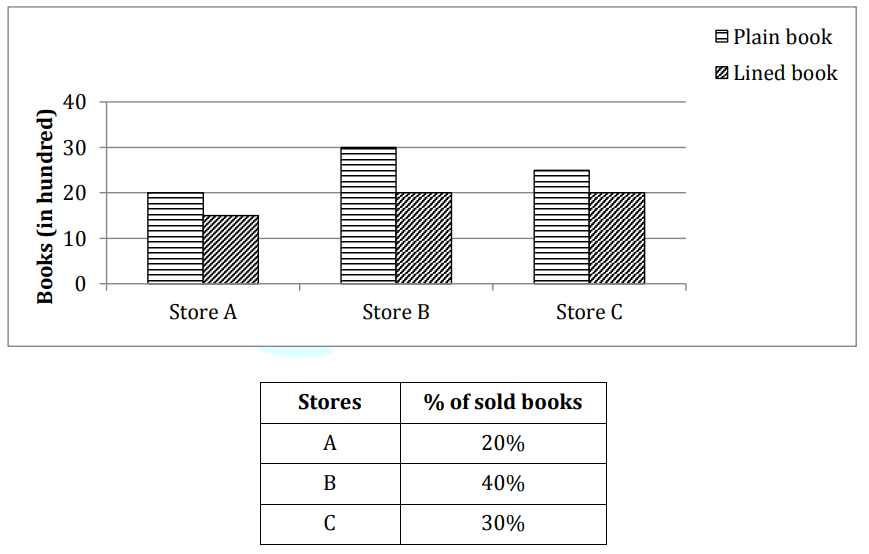
8 Q:Direction: Given bar graph shows the number of plain books and lined books (in hundreds) available at three different stores and the table shows the percentage of total books (Plain + lined) that was sold by different stores.

The average of total books sold by stores B and C together is how much more than total unsold books of store A.
1756 0603f3ae1e759ac364c902590
603f3ae1e759ac364c902590
- 11055false
- 21175false
- 31125true
- 41075false
- 51225false
- Show Answer
- Workspace
- SingleChoice
Answer : 3. "1125 "
Q:Direction: Given bar graph shows the number of plain books and lined books (in hundreds) available at three different stores and the table shows the percentage of total books (Plain + lined) that was sold by different stores.

The number of plain books sold by store A and store B was 30% and 40% respectively then find a number of lined books sold by store A and store B together is what percent of total books available at store A?
3906 0603f3a28251bf6540042d090
603f3a28251bf6540042d090
- 1false
- 2true
- 3false
- 425%false
- 5None of thesefalse
- Show Answer
- Workspace
- SingleChoice
Answer : 2. "
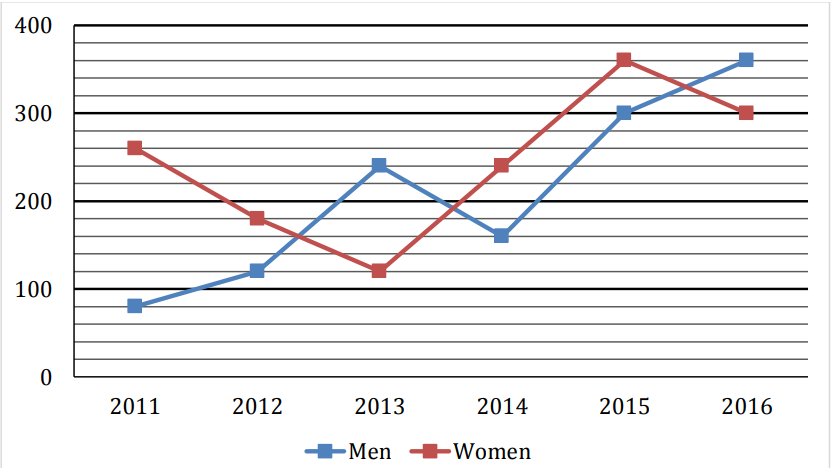
Q:Direction: The line chart given below shows the number of labors (men and women) working in six different years. Study the data carefully and answer the following questions.

Number of Men working in 2017 is 15% more than that of 2015 while number of Women working in 2017 is 40% less than that of 2014. Find total number of labors (Men + Women) working in 2017?
2367 0603dc76d6f990444b4a3ed31
603dc76d6f990444b4a3ed31
- 1594false
- 2630false
- 3561false
- 4456false
- 5489true
- Show Answer
- Workspace
- SingleChoice
Answer : 5. "489 "
Q:Direction: The line chart given below shows the number of labors (men and women) working in six different years. Study the data carefully and answer the following questions.

Total number of Men working in all six years is how much more/less than total number of Women working in all six years together?
1717 0603dcbd7ec464f505f27715e
603dcbd7ec464f505f27715e
- 1180false
- 2200true
- 3140false
- 4160false
- 5None of the given optionsfalse
- Show Answer
- Workspace
- SingleChoice
Answer : 2. "200"
Q:Direction: The line chart given below shows the number of labors (men and women) working in six different years. Study the data carefully and answer the following questions.

Find the ratio between total number of Labors working in 2012 and 2013 together to total number of labors working in 2015 and 2016 together?
1831 0603dcb36e759ac364c8ba37b
603dcb36e759ac364c8ba37b
- 135 : 66false
- 211 : 10false
- 32 : 1false
- 41 : 2true
- 5None of the given optionsfalse
- Show Answer
- Workspace
- SingleChoice
Answer : 4. "1 : 2 "
Q:Direction: The line chart given below shows the number of labors (men and women) working in six different years. Study the data carefully and answer the following questions.

Total number of Men working in 2012 and 2013 together is what percent of the total number of labors (Men + Women) working in 2014?
2890 0603dc62fcd43d04a8f5c9fc0
603dc62fcd43d04a8f5c9fc0
- 190%true
- 240%false
- 360%false
- 470%false
- 580%false
- Show Answer
- Workspace
- SingleChoice
Answer : 1. "90% "
Q:Direction: The line chart given below shows the number of labors (men and women) working in six different years. Study the data carefully and answer the following questions.

Average number of Women working in 2014, 2015 and 2016 together is how much more/less than average number of Men working in 2011, 2014 and 2016 together?
3141 0603dc6d5e759ac364c8b9e0d
603dc6d5e759ac364c8b9e0d
- 190false
- 270false
- 3100true
- 480false
- 5None of the given optionsfalse
- Show Answer
- Workspace
- SingleChoice
Answer : 3. "100 "
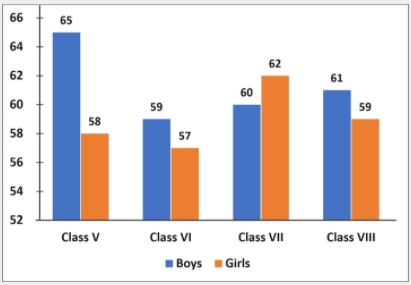
Q:Direction: The following graph shows the number of boys and girls in Class V, Class VI, Class VII and Class VIII. Study the graph and answer the question.

Which class has the maximum number of students?
1321 06037520124cd273bc4f4ac9d
6037520124cd273bc4f4ac9d
- 1Class VIfalse
- 2Class VIIIfalse
- 3Class Vtrue
- 4Class VIfalse
- Show Answer
- Workspace
- SingleChoice

