Data Interpretation Questions Practice Question and Answer
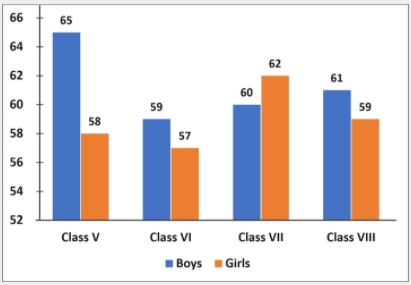
8 Q:Direction: The following graph shows the number of boys and girls in Class V, Class VI, Class VII and Class VIII. Study the graph and answer the question.

What is the average number of girls in all the classes?
956 0603751ac24cd273bc4f4abfb
603751ac24cd273bc4f4abfb
- 161false
- 259true
- 354false
- 466false
- Show Answer
- Workspace
- SingleChoice
Answer : 2. "59"
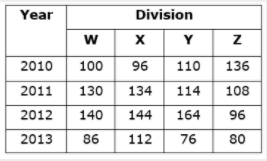
Q:Direction: The following table represents the number of items sold by four divisions of a consumer goods dealer during 2010 to 2013.

The combined sales figures in 2011 and 2013 of which division was the lowest?
896 0603750bfcd43d04a8f4b0fdd
603750bfcd43d04a8f4b0fdd
- 1Yfalse
- 2Wfalse
- 3Ztrue
- 4Xfalse
- Show Answer
- Workspace
- SingleChoice
Answer : 3. "Z"
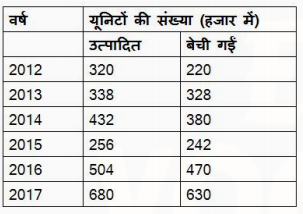
Q:The following table shows the number of units of product produced and sold by a company over the course of six years.

In which year, the production of product units is about 31.4 percent less than the units sold in 2017?
927 0602e07116d461f66398731a1
602e07116d461f66398731a1
- 12012false
- 22016false
- 32014true
- 42013false
- Show Answer
- Workspace
- SingleChoice
Answer : 3. "2014"
Q:The following table shows the number of units of product produced and sold by a company over the course of six years.

The number of units of product sold in 2016 is approximately what percent more than the average number of units produced from 2012 to 2016?
868 0602e06b16d461f6639872fc4
602e06b16d461f6639872fc4
- 124false
- 232false
- 321false
- 427true
- Show Answer
- Workspace
- SingleChoice
Answer : 4. "27"
Q:The following table shows the number of units of product produced and sold by a company over the course of six years.

Find the ratio between the total number of units sold in 2013 and 2015 and the number of units produced in 2015 and 2016?
833 0602e0668a503a25a4b89f1ae
602e0668a503a25a4b89f1ae
- 114 : 19false
- 229 : 38false
- 33 : 4true
- 47 : 9false
- Show Answer
- Workspace
- SingleChoice
Answer : 3. "3 : 4"
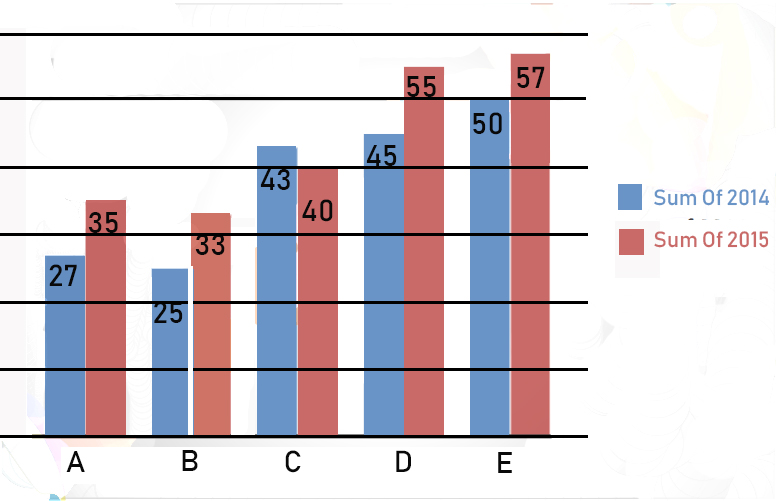
Q:Direction: The given Bar Graph Presents the number of different types of vehicles (in lakhs) exported by a company during 2014 and 2015.

The average number type A, B and D vehicles exported in 2015 was x% less than the number of type E vehicles exported in 2014. What is the value of x?
1041 0602514ac083f2c6596c29b5d
602514ac083f2c6596c29b5d
- 120false
- 225false
- 318true
- 424false
- Show Answer
- Workspace
- SingleChoice
Answer : 3. "18"
Q:Direction: The given Bar Graph Presents the number of different types of vehicles (in lakhs) exported by a company during 2014 and 2015.

Which type of vehicle showed a 32% increase in export in 2015 as compared to that in the previous year?
922 060251372cce66f776c87be6b
60251372cce66f776c87be6b
- 1Btrue
- 2Afalse
- 3Efalse
- 4Dfalse
- Show Answer
- Workspace
- SingleChoice
Answer : 1. "B"
Q:Direction: The given Bar Graph Presents the number of different types of vehicles (in lakhs) exported by a company during 2014 and 2015.

What is the ratio of the total number of type A and c vehicles exported in 2014 to the total number of type B and E vehicles exported in 2015?
763 0602512d5473e977f3667d301
602512d5473e977f3667d301
- 12:3false
- 25:7false
- 38:11false
- 47:9true
- Show Answer
- Workspace
- SingleChoice

