Data Interpretation Questions Practice Question and Answer
8 Q:Directions: The line graph shows the number of work visas issued by a country in each year from 2011 to 2016. Study the diagram and answer the following questions .
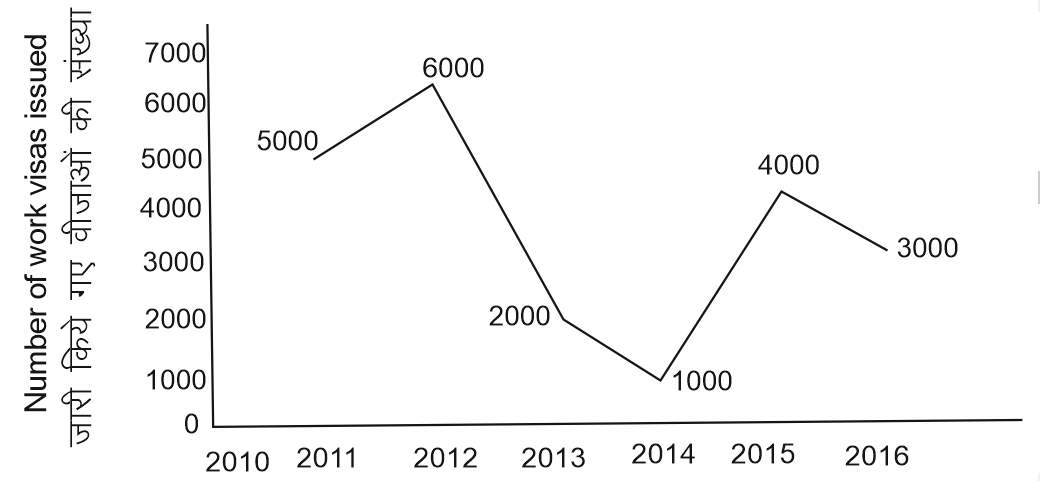
If 10 % of people who are issued work visas do not use the visas , then how many people from 2011 to 2016 have used the visas ?
862 05ed9efe0f528050f91504f7e
5ed9efe0f528050f91504f7e- 119800false
- 27800false
- 318700false
- 418900true
- Show Answer
- Workspace
- SingleChoice
Answer : 4. "18900"
Q:Directions: The line graph shows the number of work visas issued by a country in each year from 2011 to 2016. Study the diagram and answer the following questions .
What is the total number of visas issued from 2012 to 2015 ?
835 05ed9ef8be11a1c4b43e6e3b0
5ed9ef8be11a1c4b43e6e3b0- 113000true
- 218000false
- 316000false
- 47000false
- Show Answer
- Workspace
- SingleChoice
Answer : 1. "13000 "
Q: In a school of 1200, students were asked how they travelled to school. The information obtained is depicted by a pie-chart as below. From the given information find how many students come to school by Car?
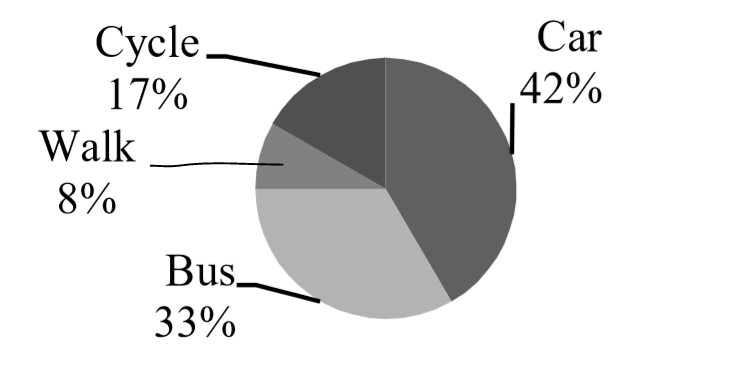
1528 05ebcc5347fbed1167f1cf2ae
5ebcc5347fbed1167f1cf2ae- 11000false
- 2504true
- 3900false
- 4750false
- Show Answer
- Workspace
- SingleChoice
Answer : 2. "504 "
Q:Comprehension: Read the following chart and answer the following questions.
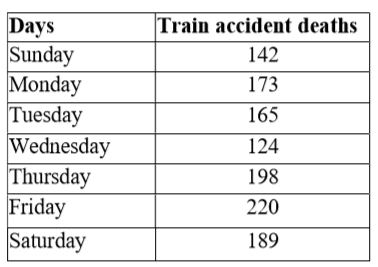
What is the average death rate per day for the week?
1053 05ebcc2da1c43d211834b4136
5ebcc2da1c43d211834b4136- 1173true
- 2172false
- 3183false
- 4163false
- Show Answer
- Workspace
- SingleChoice
Answer : 1. "173 "
Q:Comprehension: Read the following chart and answer the following questions.
What is the difference between the day that had maximum deaths to the day that had minimum deaths?
1003 05ebcc1dcd33dc17bd494cfbe
5ebcc1dcd33dc17bd494cfbe- 1104false
- 286false
- 394false
- 496true
- Show Answer
- Workspace
- SingleChoice
Answer : 4. "96"
Q:Comprehension: Read the following chart and answer the following questions.
Which day of the week recorded maximum train accident deaths?
1111 05ebcc15c1126331540e94b6e
5ebcc15c1126331540e94b6e- 1Sundayfalse
- 2Thursdayfalse
- 3Fridaytrue
- 4Saturdayfalse
- Show Answer
- Workspace
- SingleChoice
Answer : 3. "Friday "
Q:The pie chart below represents the instruments played by students of a school. Read the chart and answer the following questions based on it.
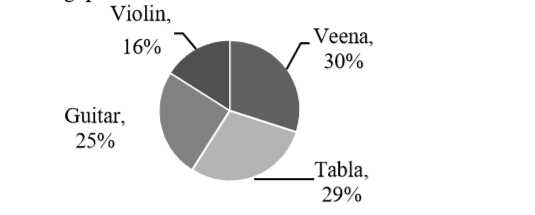
The ratio of students who play Guitar to Violin
1366 05eba32028e4fa473bcb7f6b9
5eba32028e4fa473bcb7f6b9- 15:4false
- 25:6false
- 325:16true
- 48:15false
- Show Answer
- Workspace
- SingleChoice
Answer : 3. "25:16 "
Q:The pie chart below represents the instruments played by students of a school. Read the chart and answer the following questions based on it.
If there are 300 students in total, what is the difference between those who play Tabla and those who play Veena?
1201 05eba3072a445f56aef0ad20b
5eba3072a445f56aef0ad20b- 130false
- 290false
- 33true
- 49false
- Show Answer
- Workspace
- SingleChoice