Data Interpretation Questions Practice Question and Answer
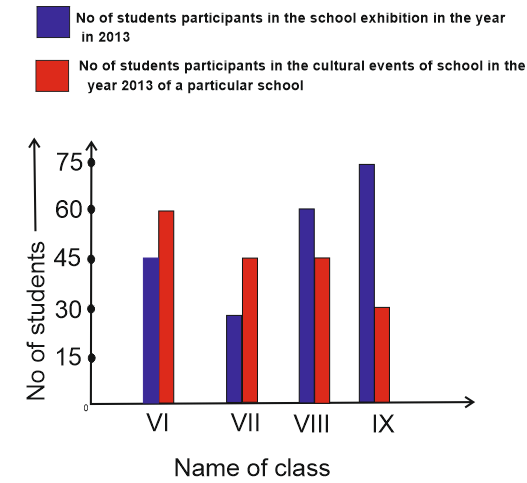
8 Q:Direction: Study the double bar graph given below and answer the questions.

The ratio of the participants in exhibition of class IX with the total participants of class IX is:
3436 05d9323026819c079458b8139
5d9323026819c079458b8139
- 15:7true
- 25:14false
- 31:4false
- 43:5false
- Show Answer
- Workspace
- SingleChoice
Answer : 1. "5:7"
Q:Direction: Study the double bar graph given below and answer the questions.

The average of the number of students participating in exhibition is:
3243 05d932291bc45ad7944d99fa0
5d932291bc45ad7944d99fa0
- 148.75false
- 252.5true
- 345false
- 450false
- Show Answer
- Workspace
- SingleChoice
Answer : 2. "52.5"
Q:Direction: Study the double bar graph given below and answer the questions.

The average of the number of students participating in cultural events is:
2446 05d9321e7c263b979273f36b1
5d9321e7c263b979273f36b1
- 148.75false
- 252.5false
- 345true
- 450false
- Show Answer
- Workspace
- SingleChoice
Answer : 3. "45"
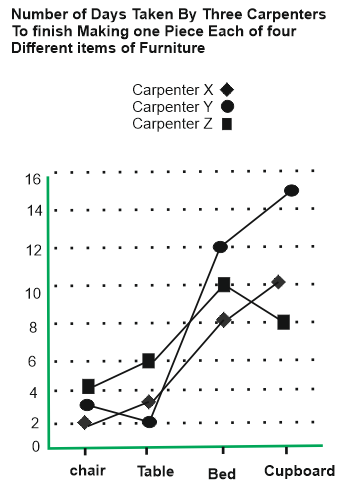
Q:Study the given graph carefully to answer the questions that follow:

If carpenter X and carpenter Y were to make a chair together how many days would they take?
1030 05d85cf58a08f7a408051b2b8
5d85cf58a08f7a408051b2b8
- 11 Daysfalse
- 24 daysfalse
- 33 daysfalse
- 42 daysfalse
- 5None of thesetrue
- Show Answer
- Workspace
- SingleChoice
Answer : 5. "None of these "
Q:Study the given graph carefully to answer the questions that follow:

What is the total number of days that carpenter Z will take to make one piece each of all the four items together?
1158 05d85d1eaa08f7a408051bd1f
5d85d1eaa08f7a408051bd1f
- 132 daystrue
- 224 daysfalse
- 318 daysfalse
- 415 daysfalse
- 5None of thesefalse
- Show Answer
- Workspace
- SingleChoice
Answer : 1. "32 days"
Q:Study the given graph carefully to answer the questions that follow:

If carpenter X, Y and Z were to make a table together how many days would they take?
1269 05d85d054a08f7a408051b773
5d85d054a08f7a408051b773
- 14 daysfalse
- 23 daysfalse
- 31 daystrue
- 42 daysfalse
- Show Answer
- Workspace
- SingleChoice
Answer : 3. "1 days"
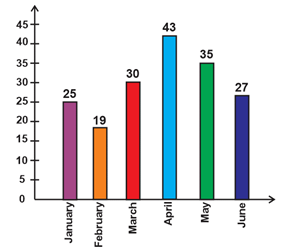
Q: The bar-chart is showing the number of Accidents in a city during the first six month of a year. Examine the bar chart and answer the following questions.
What is the percentage of accidents in the month of April to the total accidents in the city?

3759 05d775e76315eb75b14639a53
5d775e76315eb75b14639a53What is the percentage of accidents in the month of April to the total accidents in the city?

- 115%false
- 220%false
- 322%false
- 424%true
- Show Answer
- Workspace
- SingleChoice
Answer : 4. "24%"
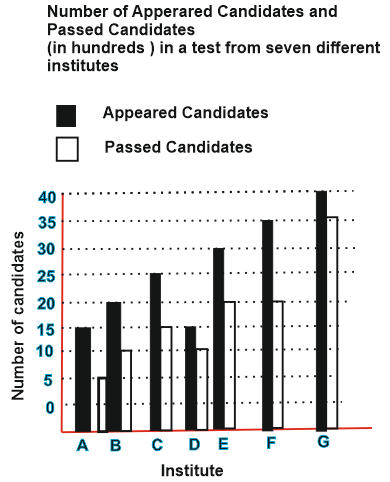
Q: Study the following graph and answer the question that follow.

What is the approximate average number of candidates passed from all the institutes together?
3013 05d860d36a08f7a4080524b13
5d860d36a08f7a4080524b13
What is the approximate average number of candidates passed from all the institutes together?
- 11460false
- 21640true
- 31350false
- 41440false
- 51530false
- Show Answer
- Workspace
- SingleChoice

