Data Interpretation Questions Practice Question and Answer
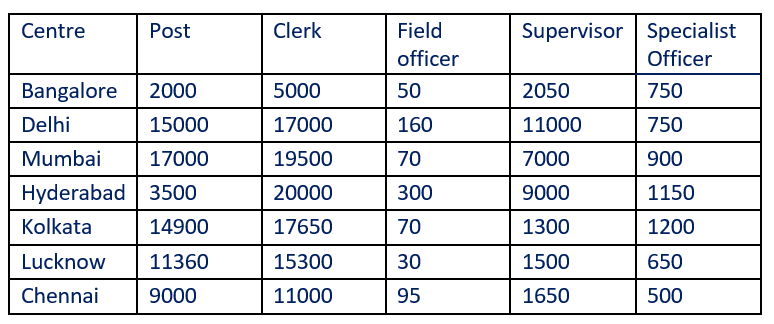
8 Q:Direction (94-98): Study the following table to answer the given questions.
Centre and Post-wise Numbered of candidate

Which centre has 300% more number of Clerks as compared to Bangalore?
1893 05da402315225a412f5163767
5da402315225a412f5163767Centre and Post-wise Numbered of candidate

- 1Lucknowfalse
- 2Mumbaifalse
- 3Hyderabadfalse
- 4Chennaifalse
- 5None of thesetrue
- Show AnswerHide Answer
- Workspace
- SingleChoice
Answer : 5. "None of these"
Q:Direction (94-98): Study the following table to answer the given questions.
Centre and Post-wise Numbered of candidate

Which centre has the highest number of candidates?
1593 05da400f4d69109270473a035
5da400f4d69109270473a035Centre and Post-wise Numbered of candidate

- 1Delhifalse
- 2Kolkatafalse
- 3Hyderabadfalse
- 4Mumbaitrue
- 5None of thesefalse
- Show AnswerHide Answer
- Workspace
- SingleChoice
Answer : 4. "Mumbai"
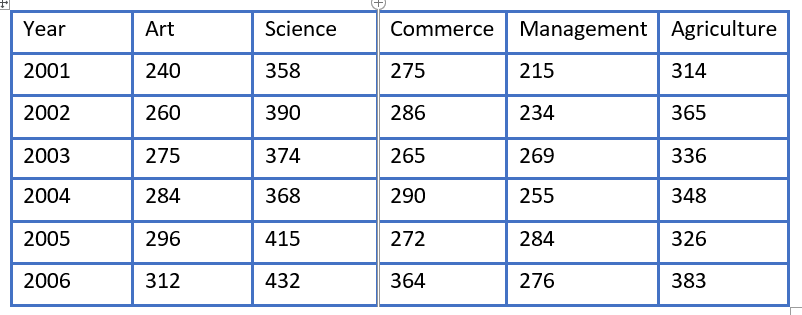
Q:Study the following table carefully and answer the questions given below.

What was approximate percentage increase in the number of students in Commerce discipline from 2003 to 2004?
1269 05da051fd0ba8fe2a19c22b84
5da051fd0ba8fe2a19c22b84
- 114false
- 218false
- 320false
- 49true
- 522false
- Show AnswerHide Answer
- Workspace
- SingleChoice
Answer : 4. "9"
Q:Study the following table carefully and answer the questions given below.

In which year the percentage change in the case of Agriculture discipline was highest from the previous year?
1133 05da0511f31905d285336376e
5da0511f31905d285336376e
- 12002false
- 22003false
- 32004false
- 42005false
- 52006true
- Show AnswerHide Answer
- Workspace
- SingleChoice
Answer : 5. "2006"
Q:Study the following table carefully and answer the questions given below.

In which discipline was there a continuous increase in number of students over the given years?
1168 05da0507000e22578c9e9910f
5da0507000e22578c9e9910f
- 1Sciencefalse
- 2Agriculturefalse
- 3Artstrue
- 4Commercefalse
- 5managementfalse
- Show AnswerHide Answer
- Workspace
- SingleChoice
Answer : 3. "Arts"
Q:Study the following table carefully and answer the questions given below.

In which year was the difference in number of students in Arts and Science exactly 130?
1388 05da04eb40ba8fe2a19c21d53
5da04eb40ba8fe2a19c21d53
- 12001false
- 22002true
- 32004false
- 42006false
- 5None of thesefalse
- Show AnswerHide Answer
- Workspace
- SingleChoice
Answer : 2. "2002"
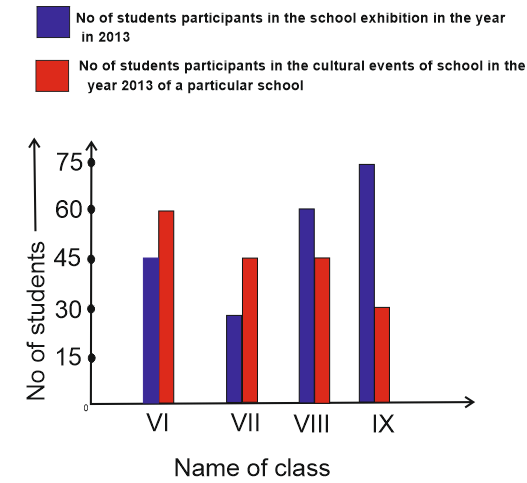
Q:Direction: Study the double bar graph given below and answer the questions.

The class having maximum number of participants in exhibitions:
1655 05d932154c263b979273f36ac
5d932154c263b979273f36ac
- 1Class IXtrue
- 2Class VIIIfalse
- 3Class VIIfalse
- 4Class VIfalse
- Show AnswerHide Answer
- Workspace
- SingleChoice
Answer : 1. "Class IX"
Q:Direction: Study the double bar graph given below and answer the questions.

The percentage of students of class VIII participating in cultural event out of total participants of cultural event is
4355 05d93238ac263b979273f36db
5d93238ac263b979273f36db
- 130%false
- 225%true
- 335%false
- 440%false
- Show AnswerHide Answer
- Workspace
- SingleChoice

