Data Interpretation Questions Practice Question and Answer
8 Q:Study the following pie-diagrams carefully and answer the question given below it.
PERCENTAGE COMPOSITION OF HUMAN BODY
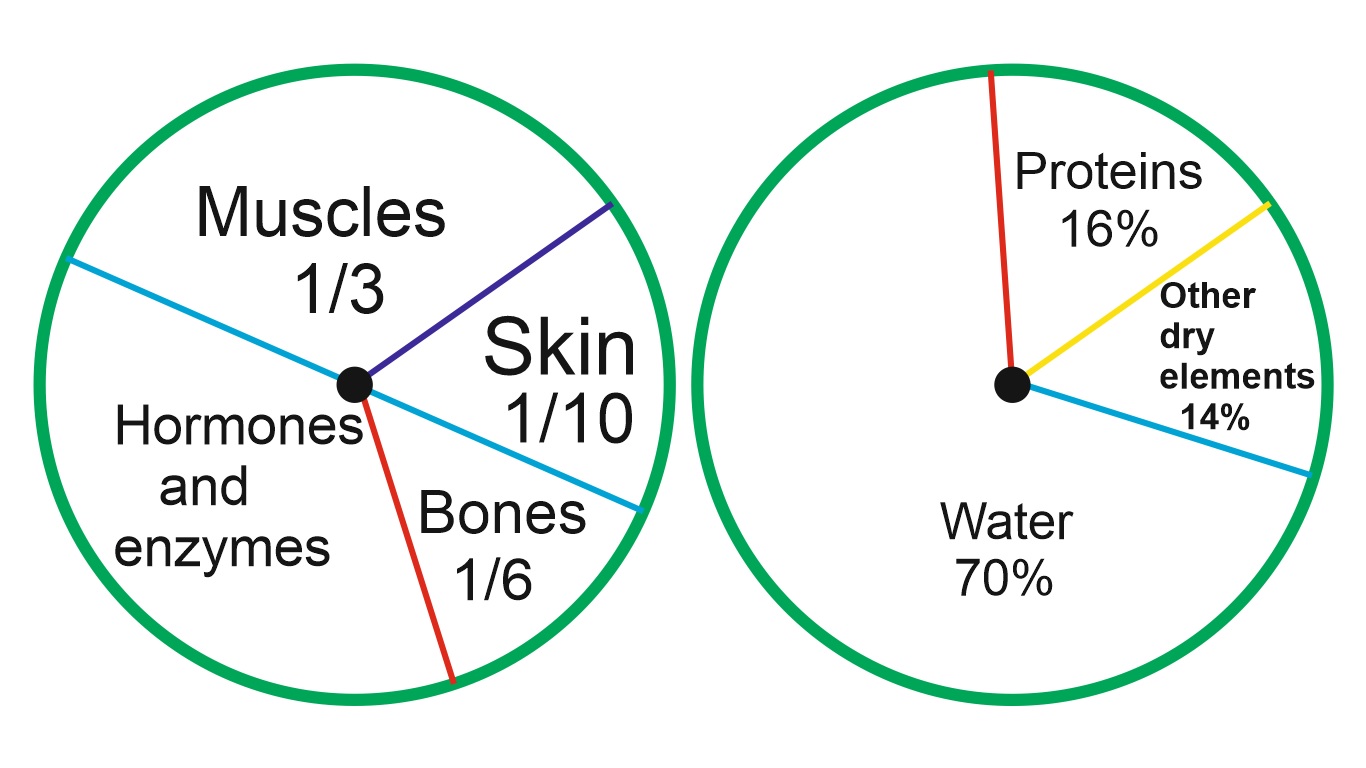
What is the ratio of the distribution of proteins in the muscles to that of the distribution of proteins in the bones? 1628 05c2ca3439fd00135a4b20f5e
5c2ca3439fd00135a4b20f5ePERCENTAGE COMPOSITION OF HUMAN BODY

- 11: 18false
- 21: 2false
- 32: 1true
- 418: 1false
- Show Answer
- Workspace
- SingleChoice
Answer : 3. "2: 1"
Q:The circle-graph given here shows the spending of a country on various sports during a particular year. Study the graph carefully and answer the question given below it.
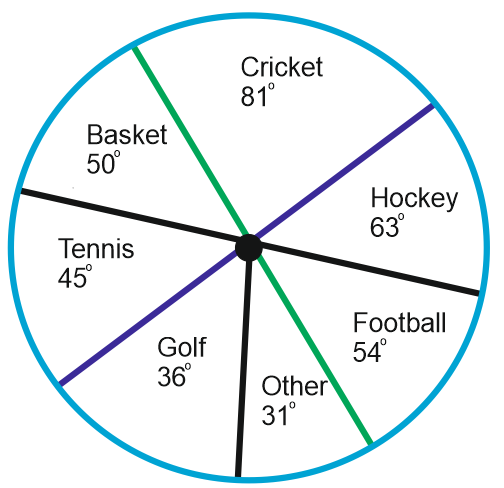
How much percent is more spent on Hockey than that on Golf?
1296 05d70aacf9004b376a58bd1b3
5d70aacf9004b376a58bd1b3
- 127 %false
- 235 %false
- 337.5 %false
- 475 %true
- Show Answer
- Workspace
- SingleChoice
Answer : 4. "75 %"
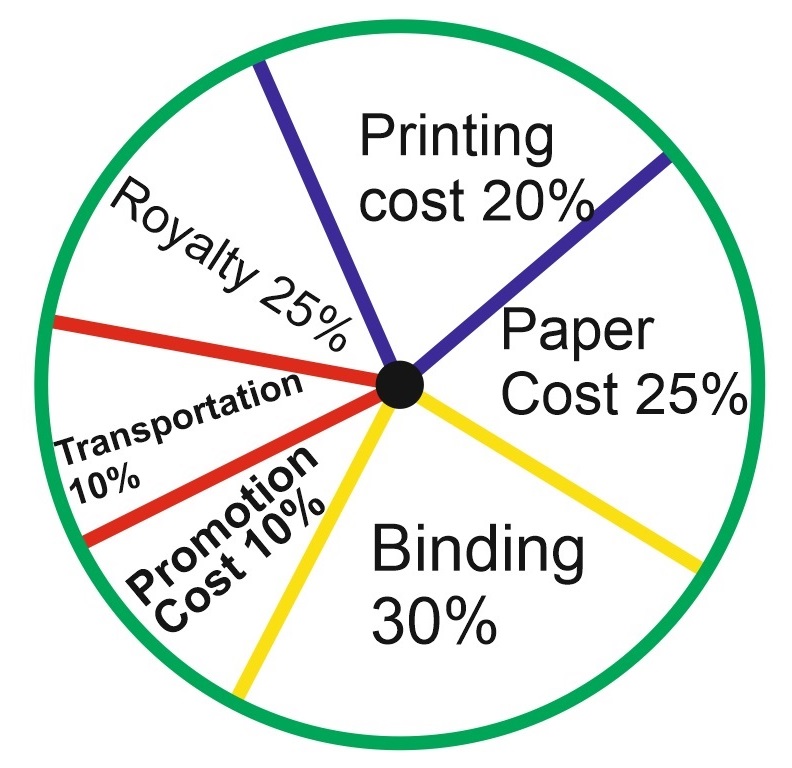
Q: If for a certain quantity of books, the publisher has to pay Rs. 30,600 as printing cost, then what will be the amount of royalty to be paid for these books?
1680 05d70b6cad8eebc768d112b28
5d70b6cad8eebc768d112b28
- 1Rs. 19,450false
- 2Rs. 21,200false
- 3Rs. 22,950true
- 4Rs. 26,150false
- Show Answer
- Workspace
- SingleChoice
Answer : 3. "Rs. 22,950"
Explanation :
Let the amount of Royalty to be paid for these books be Rs. p.
Then, 20 : 15 = 30600 : r ⇒ r = Rs. ![]() = Rs. 22950.
= Rs. 22950.
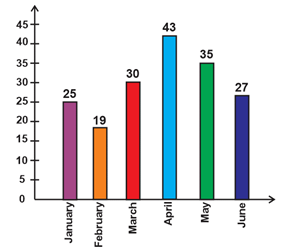
Q: The bar-chart is showing the number of Accidents in a city during the first six month of a year. Examine the bar chart and answer the following questions.
What is the percentage of accidents in the month of April to the total accidents in the city?
3765 05d775e76315eb75b14639a53
5d775e76315eb75b14639a53What is the percentage of accidents in the month of April to the total accidents in the city?

- 115%false
- 220%false
- 322%false
- 424%true
- Show Answer
- Workspace
- SingleChoice
Answer : 4. "24%"
Q:Direction: Study the double bar graph given below and answer the questions.
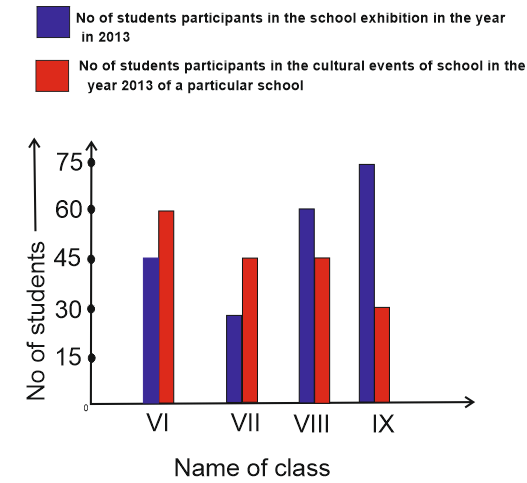
The class having maximum number of participants in exhibitions:
1407 05d932154c263b979273f36ac
5d932154c263b979273f36ac
- 1Class IXtrue
- 2Class VIIIfalse
- 3Class VIIfalse
- 4Class VIfalse
- Show Answer
- Workspace
- SingleChoice
Answer : 1. "Class IX"
Q:Direction: The following diagram shows the percentage of population of Hindus, Sikhs and Muslims with respect to total population in a town during 2005 to 2008. Study the diagram and answer the questions:
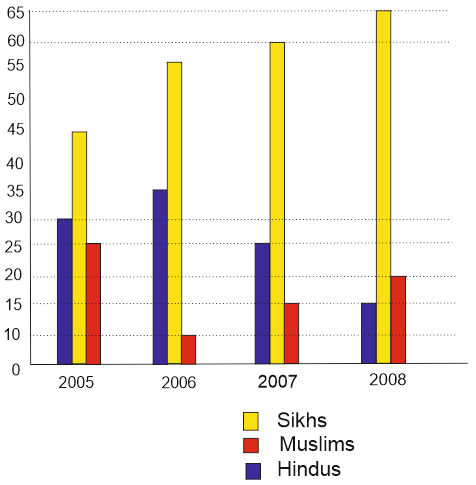
If the total number of Hindus in 2008 was 12 lakh, the number of Muslim in 2008 was (in lakh)
1032 05dccdfc6ef0a14548c1d6084
5dccdfc6ef0a14548c1d6084
- 118false
- 212false
- 324false
- 416true
- Show Answer
- Workspace
- SingleChoice
Answer : 4. "16"
Q:Directions: Study the following table carefully to answer the questions that follow .
Number of soldiers ( in thousands ) joining five different forces during six different.

What was the ratio of the number of soldiers joining Army in the year 2008 to the number of soldiers joining Army in the year 2006?
1178 05e82e924fb2b5f39957b682e
5e82e924fb2b5f39957b682eNumber of soldiers ( in thousands ) joining five different forces during six different.

- 15:2false
- 23:7true
- 34:3false
- 45:1false
- 5None of thesefalse
- Show Answer
- Workspace
- SingleChoice
Answer : 2. "3:7 "
Q:Study the following bar chart and answer the questions carefully.
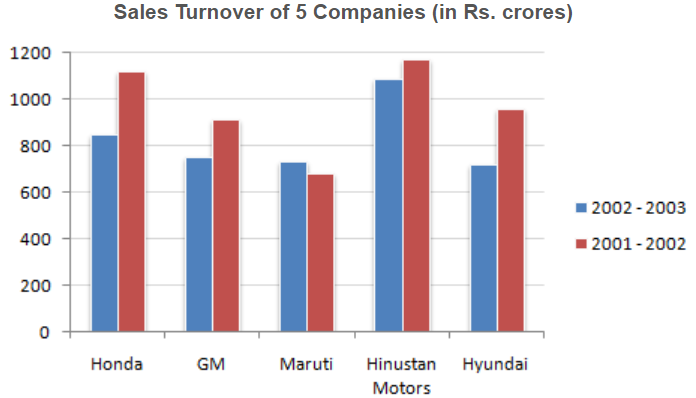
Which of the companies shows the maximum percentage difference in sales turnover between the two years ?
1054 05fd33b8ec46a213fc5c4fe25
5fd33b8ec46a213fc5c4fe25
- 1Hondafalse
- 2GMfalse
- 3Hyundaitrue
- 4Marutifalse
- 5None of thesefalse
- Show Answer
- Workspace
- SingleChoice

