Data Interpretation Questions Practice Question and Answer
8 Q:Directions: Study the Bar diagram carefully and answer the questions.
The Bar diagram shows the trends of foreign direct investment (FDI) into India from all over the World (in Rs. crores).
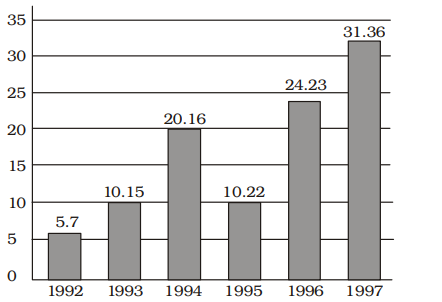
The sum of FDI of 1992 and 1993 is
693 063a569f024e8fb08b9fe1729
63a569f024e8fb08b9fe1729 - 1Rs. 15.58 croresfalse
- 2Rs. 15.85 crorestrue
- 3Rs. 15.22 croresfalse
- 4Rs. 15.65 croresfalse
- Show AnswerHide Answer
- Workspace
- SingleChoice
Answer : 2. "Rs. 15.85 crores "
Q:Direction: Study the following line graph carefully and answer the questions given below.
In the below line graph, the number of animals in two zoo A and B in the years – 2001, 2003, 2005 and 2007 is given.
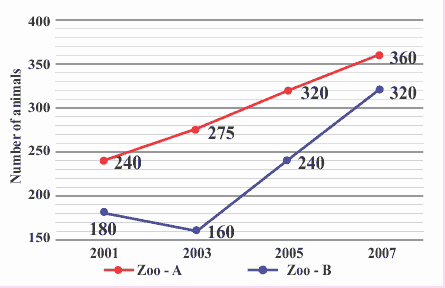
If the number of animals in zoo-B in the years 2009 is 25% more than that in the year 2007, then what is the average number of animals in zoo-B in the years 2005, 2007 and 2009?
693 064e5dd093be218b6cdc27542
64e5dd093be218b6cdc27542In the below line graph, the number of animals in two zoo A and B in the years – 2001, 2003, 2005 and 2007 is given.
- 1260false
- 2320true
- 3260false
- 4240false
- 5None of thesefalse
- Show AnswerHide Answer
- Workspace
- SingleChoice
Answer : 2. "320"
Q:Directions : Study the following graph and answer the questions.
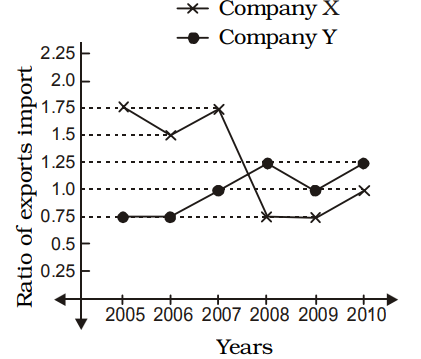
In 2005, the exports of company X were double that of company Y in that year. If the imports of company X during the year were 180 crores, what was the amount (in crore) of imports of company Y during the year?
691 063a5564424e8fb08b9fd64c7
63a5564424e8fb08b9fd64c7 - 1212false
- 2210true
- 3315false
- 4282false
- Show AnswerHide Answer
- Workspace
- SingleChoice
Answer : 2. "210 "
Q:Directions: A survery of film watching habits of people living in five cities P, Q, R, S and T is summarised below in a table. The coulmn I in the table gives percentage of film-watchers in each city who see only one film a week. The column II gives the total number of film-watchers who see two or more films per week.
Read the table and answer the following questions.
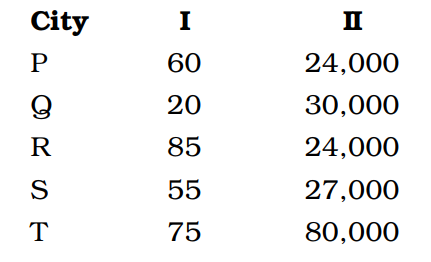
Which city has the highest number of film watchers who see only one film in a week?
690 0632db57a1656651c9eaaf48c
632db57a1656651c9eaaf48c- 1Pfalse
- 2Rfalse
- 3Sfalse
- 4Ttrue
- Show AnswerHide Answer
- Workspace
- SingleChoice
Answer : 4. "T "
Q:Directions: Study the following information carefully and answer the questions given below.
In the table, the percentage of shirts (formal and casual) sold out of the total number of shirts sold in the week and the number of casual shirts sold data related to the number of shirts sold on ve weekdays – Monday, Tuesday, Wednesday, Thursday and Friday are given.
Total number of shirts sold in the week = x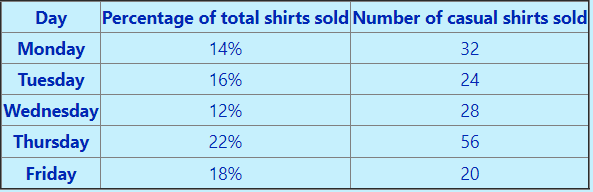 Note: Total number of shirts sold on Saturday and Sunday together = 72
What is the sum of the formal shirts sold on Monday, Tuesday and Wednesday together?
689 064e5edc9d928d8b7160e3c6a
64e5edc9d928d8b7160e3c6aIn the table, the percentage of shirts (formal and casual) sold out of the total number of shirts sold in the week and the number of casual shirts sold data related to the number of shirts sold on ve weekdays – Monday, Tuesday, Wednesday, Thursday and Friday are given.
Note: Total number of shirts sold on Saturday and Sunday together = 72- 1102false
- 2168false
- 384true
- 464false
- 5None of thesefalse
- Show AnswerHide Answer
- Workspace
- SingleChoice
Answer : 3. "84"
Q:Directions : The following graph shows production (in thousands) of two types (P and Q) of vehicles by a factory over the years 2009 to 2014. Study the graph and answer the given questions.
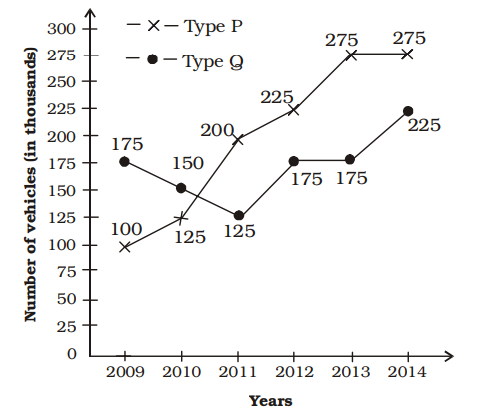
In how many of the given years, was the production of Type P vehicles of the company more than the average production of this type vehicles in the given years?
687 063a56c9824e8fb08b9fe1f85
63a56c9824e8fb08b9fe1f85 - 13true
- 24false
- 32false
- 45false
- Show AnswerHide Answer
- Workspace
- SingleChoice
Answer : 1. "3 "
Q:Directions : A bar graph showing the heights of six mountain peaks is given below. Study the bar graph and answer the questions.

Which peak is the second highest ?
684 063930c38d319b37ca19af109
63930c38d319b37ca19af109- 1Bfalse
- 2Ctrue
- 3Afalse
- 4Efalse
- Show AnswerHide Answer
- Workspace
- SingleChoice
Answer : 2. "C "
Q:Directions : In an Institution there are 800 students. Students use different modes of transport for going to the institution and return. The given pie diagram represents the requisite data. Study the diagram carefully and answer the questions.

If the total amount spent by the Government during the year was ₹ 3,00,000 crores, the amount spent on state development exceeds that on sports by
682 063ac34874edf0d569930f73f
63ac34874edf0d569930f73f- 1₹ 30,000 croretrue
- 2₹ 45,000 crorefalse
- 3₹ 35,000 crorefalse
- 4₹ 25,000 crorefalse
- Show AnswerHide Answer
- Workspace
- SingleChoice