Data Interpretation Questions Practice Question and Answer
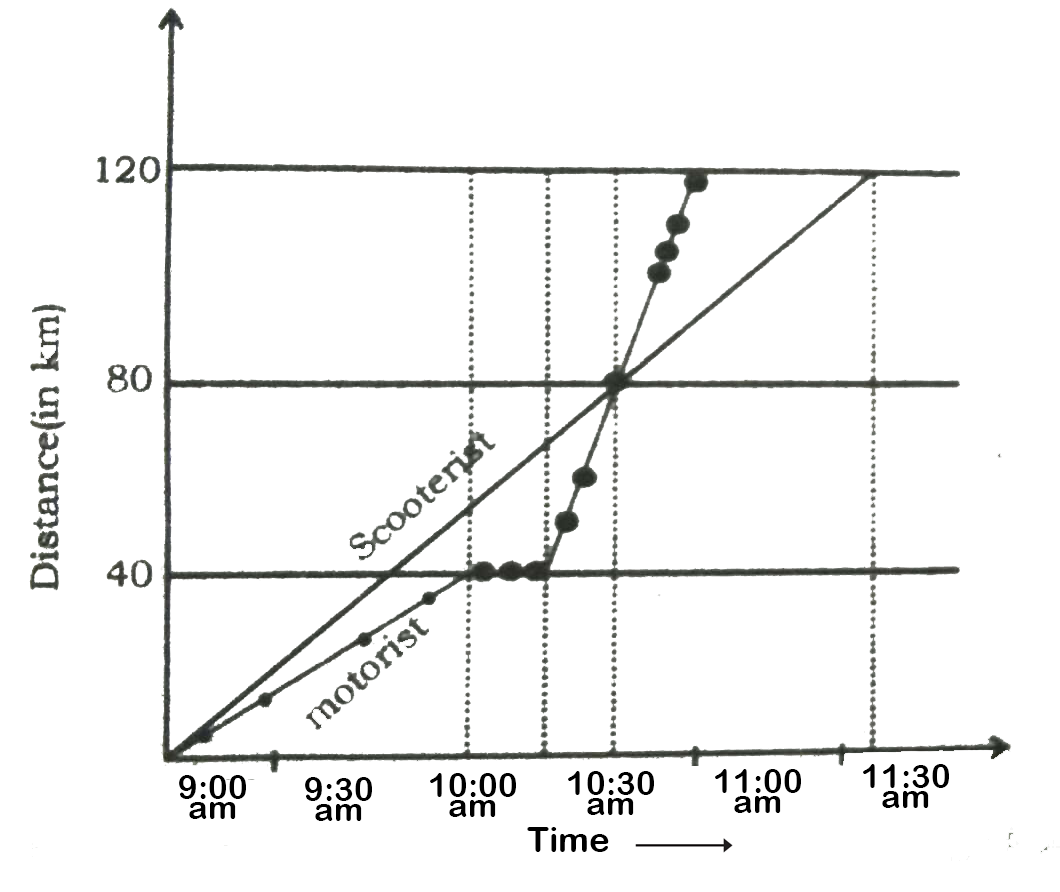
8 Q:A motorist and a scooterist made a journey of 120 km at the same time and from the same place. The graph shows the progress of the journey made by each person. Study the graph and answer the questions.

At what time did the motorist meet the scooterist?
1086 05dd67c707780ee35515c325a
5dd67c707780ee35515c325a
- 110:30 amtrue
- 210:45 amfalse
- 310:15 amfalse
- 410:20 amfalse
- Show Answer
- Workspace
- SingleChoice
Answer : 1. "10:30 am "
Q:A motorist and a scooterist made a journey of 120 km at the same time and from the same place. The graph shows the progress of the journey made by each person. Study the graph and answer the questions.

What was the speed of the scooterist during the journey? (in kmph)
938 05dd67cecdb51363c023a5dd1
5dd67cecdb51363c023a5dd1
- 145false
- 248true
- 342false
- 446false
- Show Answer
- Workspace
- SingleChoice
Answer : 2. "48 "
Q:A motorist and a scooterist made a journey of 120 km at the same time and from the same place. The graph shows the progress of the journey made by each person. Study the graph and answer the questions.

The scooterist completes the journey (in hours):
865 05dd67d90a1c5834595c50f4f
5dd67d90a1c5834595c50f4f
- 13false
- 22false
- 3true
- 4false
- Show Answer
- Workspace
- SingleChoice
Answer : 3. "
Q:A motorist and a scooterist made a journey of 120 km at the same time and from the same place. The graph shows the progress of the journey made by each person. Study the graph and answer the questions.

How far from the start, did the motorist meet the scooterist ? (in km )
1015 05dd67dfedb51363c023a62a0
5dd67dfedb51363c023a62a0
- 175false
- 270false
- 390false
- 480true
- Show Answer
- Workspace
- SingleChoice
Answer : 4. "80"
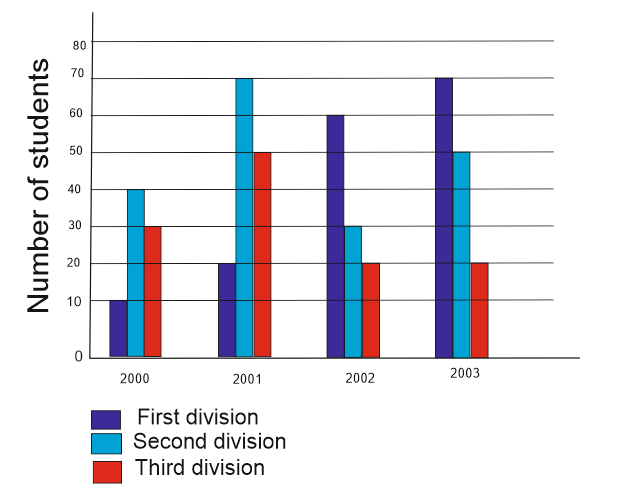
Q:The following penalty diagram shows the 4 year exam results of the students of 10th standard. Study the diagram and answer the following questions.

State the percentage increase in the first division in the year 2003 as compared to the year 2002:
853 05dd4deaca1c5834595c1342a
5dd4deaca1c5834595c1342a
- 116%false
- 2true
- 345%false
- 455%false
- Show Answer
- Workspace
- SingleChoice
Answer : 2. "
Q:The following penalty diagram shows the 4 year exam results of the students of 10th standard. Study the diagram and answer the following questions.

Name the number of students who appeared in the 10th standard examination in the year 2002-
960 05dd4de3cc2282c484e48c334
5dd4de3cc2282c484e48c334
- 1110true
- 290false
- 380false
- 4120false
- Show Answer
- Workspace
- SingleChoice
Answer : 1. "110"
Q:The following penalty diagram shows the 4 year exam results of the students of 10th standard. Study the diagram and answer the following questions.

What is the ratio of the total students who have attained second division in the year 2000 and appeared in the examination?
899 05dd4def57780ee3551584a51
5dd4def57780ee3551584a51
- 11:4true
- 21:3false
- 33:4false
- 41:2false
- Show Answer
- Workspace
- SingleChoice
Answer : 1. "1:4"
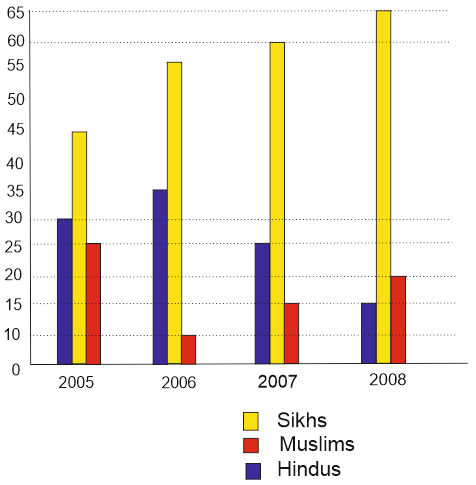
Q:Direction: The following diagram shows the percentage of population of Hindus, Sikhs and Muslims with respect to total population in a town during 2005 to 2008. Study the diagram and answer the questions:

If the total number of Hindus in 2008 was 12 lakh, the number of Muslim in 2008 was (in lakh)
1035 05dccdfc6ef0a14548c1d6084
5dccdfc6ef0a14548c1d6084
- 118false
- 212false
- 324false
- 416true
- Show Answer
- Workspace
- SingleChoice

