Data Interpretation Questions Practice Question and Answer
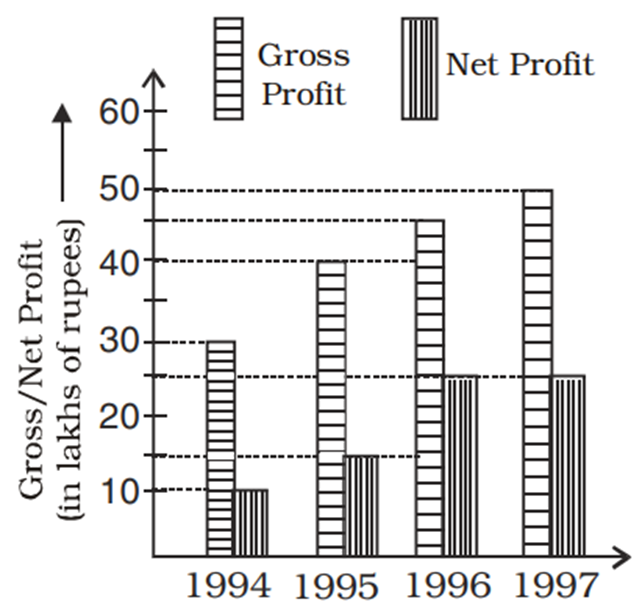
8 Q:Directions : Study the following bar graph and answer the questions.
company (in lakhs of rupees) for the years 1994-1997:

The ratio of gross profit to net profit in a year was greatest in the year
330 06460f638cdae930acb746048
6460f638cdae930acb746048
- 11994true
- 21995false
- 31996false
- 41997false
- Show AnswerHide Answer
- Workspace
- SingleChoice
Answer : 1. "1994 "
Q:Directions : Study the following bar graph and answer the questions.
company (in lakhs of rupees) for the years 1994-1997:

The difference of average gross profit and average net profit calculated for four years is
351 06460f5b04f2cce984334df0c
6460f5b04f2cce984334df0c
- 118.75 lakhsfalse
- 219.75 lakhsfalse
- 320.5 lakhsfalse
- 422.5 lakhstrue
- Show AnswerHide Answer
- Workspace
- SingleChoice
Answer : 4. "22.5 lakhs "
Q:Directions : Study the following bar graph and answer the questions.
company (in lakhs of rupees) for the years 1994-1997:

The percentage of net profit of 1995 as compared to the gross profit in that year is
308 06460f549c899b466f4458b03
6460f549c899b466f4458b03
- 125.5%false
- 235.5%false
- 337.5%true
- 442.5%false
- Show AnswerHide Answer
- Workspace
- SingleChoice
Answer : 3. "37.5% "
Q:Directions : Study the following bar graph and answer the questions.
company (in lakhs of rupees) for the years 1994-1997:

The year in which the gross profit is double the net profit
274 06460f4e7c899b466f4458a0a
6460f4e7c899b466f4458a0a
- 11997true
- 21995false
- 31996false
- 41994false
- Show AnswerHide Answer
- Workspace
- SingleChoice
Answer : 1. "1997 "
Q:Directions: The sub divided bar diagram given below depicts Higher secondary Students of a school for three years. Study the diagram and answer the questions

The percentage of the students passed with 2nd division in the year 2010 was
418 0645ce8abe67f3b0a568e543a
645ce8abe67f3b0a568e543a
- 130%true
- 240%false
- 350%false
- 460%false
- Show AnswerHide Answer
- Workspace
- SingleChoice
Answer : 1. "30% "
Q:Directions: The sub divided bar diagram given below depicts Higher secondary Students of a school for three years. Study the diagram and answer the questions

The number of students passed with 3rd division in the year 2008 was
367 0645ce82d4d91510a5da93b1f
645ce82d4d91510a5da93b1f
- 150false
- 260true
- 370false
- 480false
- Show AnswerHide Answer
- Workspace
- SingleChoice
Answer : 2. "60 "
Q:Directions: The sub divided bar diagram given below depicts Higher secondary Students of a school for three years. Study the diagram and answer the questions

In which year the school had the best result for Higher Secondary in respect of percentage of pass candidates?
424 0645ce7c7f75f230a7a679ad4
645ce7c7f75f230a7a679ad4
- 12008true
- 22009false
- 32010false
- 4The percentage of pass candidates are same for the three years.false
- Show AnswerHide Answer
- Workspace
- SingleChoice
Answer : 1. "2008 "
Q:Directions: The sub divided bar diagram given below depicts Higher secondary Students of a school for three years. Study the diagram and answer the questions

The percentage passed in 1st division in 2008 was
377 0645ce5b945f1450a80b9e89d
645ce5b945f1450a80b9e89d
- 127%false
- 232%false
- 3$$15{3\over 8}\% $$false
- 4$$11{13\over 17}\% $$true
- Show AnswerHide Answer
- Workspace
- SingleChoice

