Data Interpretation Questions Practice Question and Answer
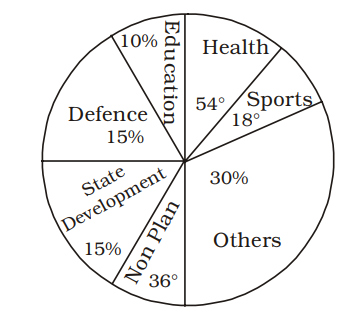
8 Q:Directions : The expenses of a country for a particular year is given in Pie–Chart. Read the Pie– Chart and answer the questions.

The percent of excess money spent on Others than that on Sports is
543 063ac35174edf0d569930f9f0
63ac35174edf0d569930f9f0
- 120%false
- 225%true
- 350%false
- 428%false
- Show AnswerHide Answer
- Workspace
- SingleChoice
Answer : 2. "25%"
Q:Directions : The expenses of a country for a particular year is given in Pie–Chart. Read the Pie– Chart and answer the questions.

The percent of less money spent on nonplan than that on defense is
633 063ac34ce612ead74ab54e318
63ac34ce612ead74ab54e318
- 115%false
- 25%true
- 312%false
- 410%false
- Show AnswerHide Answer
- Workspace
- SingleChoice
Answer : 2. "5% "
Q:Directions : In an Institution there are 800 students. Students use different modes of transport for going to the institution and return. The given pie diagram represents the requisite data. Study the diagram carefully and answer the questions.

If the total amount spent by the Government during the year was ₹ 3,00,000 crores, the amount spent on state development exceeds that on sports by
394 063ac34874edf0d569930f73f
63ac34874edf0d569930f73f
- 1₹ 30,000 croretrue
- 2₹ 45,000 crorefalse
- 3₹ 35,000 crorefalse
- 4₹ 25,000 crorefalse
- Show AnswerHide Answer
- Workspace
- SingleChoice
Answer : 1. "₹ 30,000 crore "
Q:Directions : The expenses of a country for a particular year is given in Pie–Chart. Read the Pie– Chart and answer the questions.

If the total amount spent by the Government during the year was ₹ 1,00,000 crores, then the amount spent on Health and Education together was
402 063ac3433612ead74ab54df8b
63ac3433612ead74ab54df8b
- 1₹ 25,000 croretrue
- 2₹ 20,000 crorefalse
- 3₹ 30,000 crorefalse
- 4₹ 15,000 crorefalse
- Show AnswerHide Answer
- Workspace
- SingleChoice
Answer : 1. "₹ 25,000 crore "
Q:Directions : In an Institution there are 800 students. Students use different modes of transport for going to the institution and return. The given pie diagram represents the requisite data. Study the diagram carefully and answer the questions.

The number of students who go to institute on foot is
458 063ac336e612ead74ab54dc90
63ac336e612ead74ab54dc90
- 1160true
- 2170false
- 3120false
- 4106false
- Show AnswerHide Answer
- Workspace
- SingleChoice
Answer : 1. "160 "
Q:Directions : In an Institution there are 800 students. Students use different modes of transport for going to the institution and return. The given pie diagram represents the requisite data. Study the diagram carefully and answer the questions.

The number of students who do not use institute bus is
496 063ac3322e541fa7a013045e0
63ac3322e541fa7a013045e0
- 1330false
- 2350false
- 3480false
- 4320true
- Show AnswerHide Answer
- Workspace
- SingleChoice
Answer : 4. "320 "
Q:Directions : In an Institution there are 800 students. Students use different modes of transport for going to the institution and return. The given pie diagram represents the requisite data. Study the diagram carefully and answer the questions.

The number of students who travel in public bus is
435 063ac32e2fb04114b2d3cea1a
63ac32e2fb04114b2d3cea1a
- 1150false
- 2120true
- 3130false
- 4125false
- Show AnswerHide Answer
- Workspace
- SingleChoice
Answer : 2. "120"
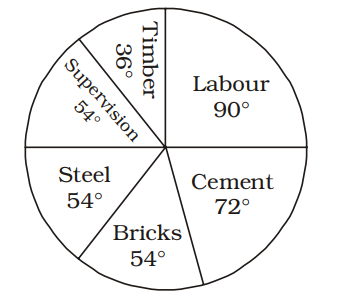
Q:Directions : The pie graph indicates the break-up of the cost of construction of a house. Assuming that the total cost of construction is Rs 6,00,000, answer the following questions.

The percentage of the total cost of construction spent on cement, steel and supervision is :
521 063aac4d45770eb565d513939
63aac4d45770eb565d513939
- 150%true
- 255%false
- 360%false
- 465%false
- Show AnswerHide Answer
- Workspace
- SingleChoice

