Data Interpretation Questions Practice Question and Answer
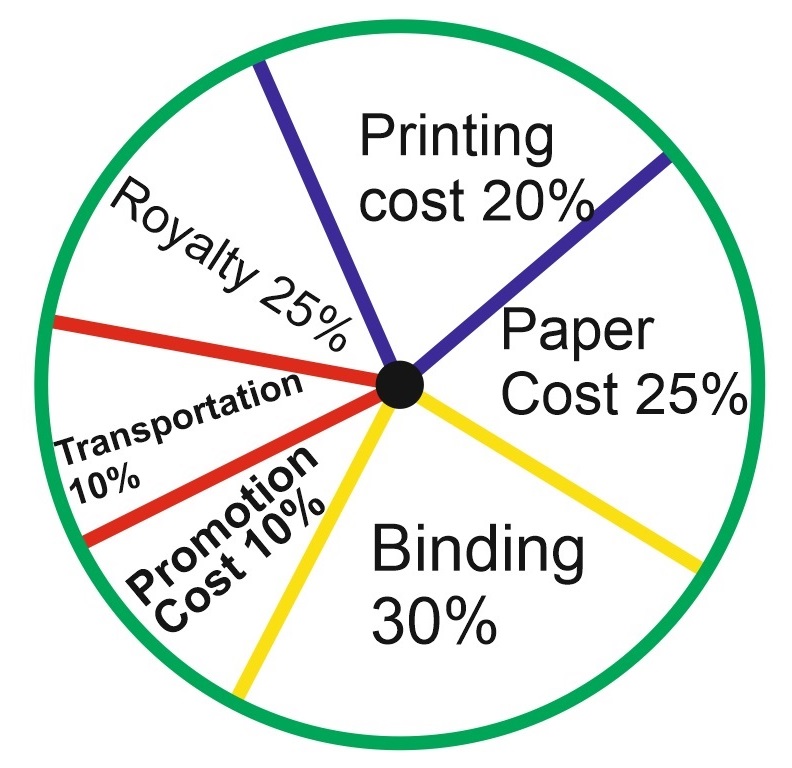
8 Q: If the difference between the two expenditures is represented by 1800 in the pie-chart, then these expenditures possibly are:
1347 05d70c99ed8eebc768d114081
5d70c99ed8eebc768d114081
- 1Binding Cost and Promotion Costfalse
- 2Paper Cost and Royaltyfalse
- 3Binding Cost and Printing Costfalse
- 4Paper Cost and Printing Costtrue
- Show AnswerHide Answer
- Workspace
- SingleChoice
Answer : 4. "Paper Cost and Printing Cost"
Q:The following pie-chart shows the monthly expenditure of family on various items. If the family spends Rs. 825 on clothing answer the question
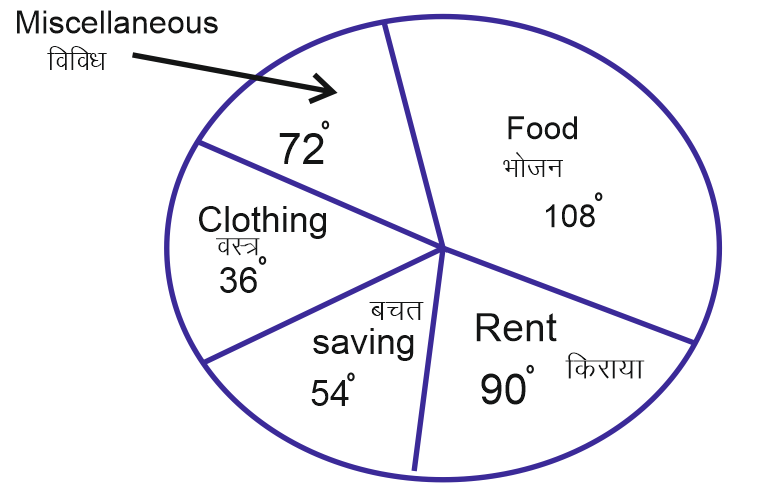
What is the total monthly income of the family?
1345 05de4e10f76066724df64c2c8
5de4e10f76066724df64c2c8- 1Rs. 8025false
- 2Rs. 8520false
- 3Rs. 8250true
- 4Rs. 8052/false
- Show AnswerHide Answer
- Workspace
- SingleChoice
Answer : 3. "Rs. 8250"
Q:Direction: Study the following graph carefully and answer the questions that follow:
The graph given below represents the number of users of two broadband services A and B across 5 cities P, Q, R, S and T.
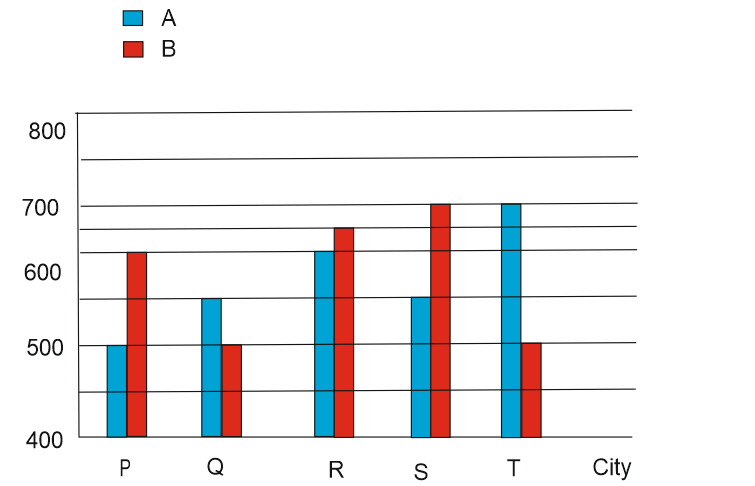
What is the total number of users of brand B across all five cities together?
1345 05df0bb273d76f974e561f39e
5df0bb273d76f974e561f39eThe graph given below represents the number of users of two broadband services A and B across 5 cities P, Q, R, S and T.
- 12700false
- 23000true
- 33100false
- 42900false
- 53200false
- Show AnswerHide Answer
- Workspace
- SingleChoice
Answer : 2. "3000"
Q:Direction: Study the following graph carefully and answer the questions that follow:
The graph given below represents the number of users of two broadband services A and B across 5 cities P, Q, R, S and T.
What is the average number of users of brand A across all five cities together?
1344 05df0bcc53d76f974e561f6f3
5df0bcc53d76f974e561f6f3The graph given below represents the number of users of two broadband services A and B across 5 cities P, Q, R, S and T.
- 1560false
- 2570false
- 3580true
- 4590false
- 5550false
- Show AnswerHide Answer
- Workspace
- SingleChoice
Answer : 3. "580"
Q:Direction: Study the following graph and answer the given question.
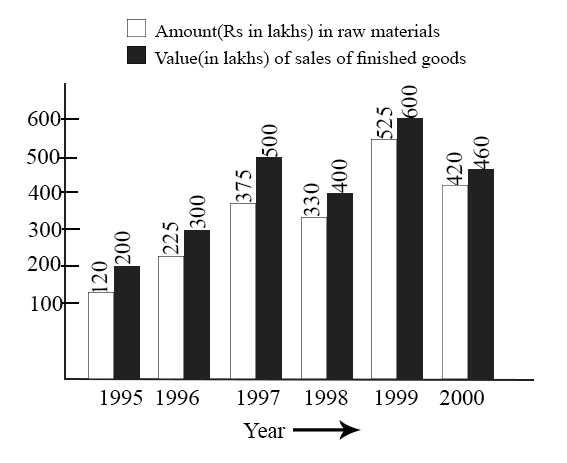
In which year, there has been a maximum percentage increase in the amount invested in raw materials as compared to the previous year?
1342 05d9dae6583cbd37fec6502ec
5d9dae6583cbd37fec6502ec- 11996true
- 21997false
- 31998false
- 41999false
- Show AnswerHide Answer
- Workspace
- SingleChoice
Answer : 1. "1996 "
Q:Study the given graph carefully to answer the questions that follow:
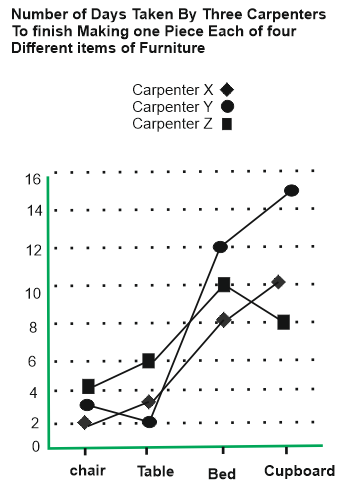
What is the total number of days that carpenter Z will take to make one piece each of all the four items together?
1339 05d85d1eaa08f7a408051bd1f
5d85d1eaa08f7a408051bd1f- 132 daystrue
- 224 daysfalse
- 318 daysfalse
- 415 daysfalse
- 5None of thesefalse
- Show AnswerHide Answer
- Workspace
- SingleChoice
Answer : 1. "32 days"
Q:Directions : The graph shows the demand and production of different companies. Study the graph and answer the following questions.
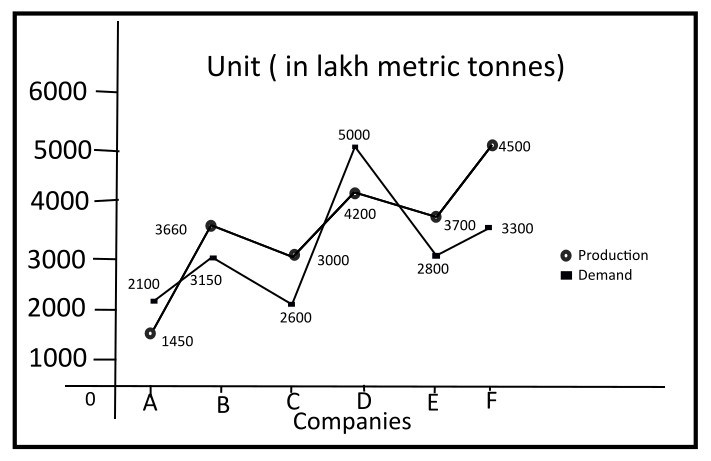
The demand of company B is what percentage of the production of company F ?
1335 05f4f72000c72eb2349336a22
5f4f72000c72eb2349336a22- 150%false
- 270%true
- 380%false
- 460%false
- Show AnswerHide Answer
- Workspace
- SingleChoice
Answer : 2. "70%"
Q:Direction: Study the following graph carefully and answer the questions that follow:
The graph given below represents the number of users of two broadband services A and B across 5 cities P, Q, R, S and T.
The number of users of brand A in city T is what percent of the number of users of brand B in city Q?
1330 05df0bc51e837331209ea1929
5df0bc51e837331209ea1929The graph given below represents the number of users of two broadband services A and B across 5 cities P, Q, R, S and T.
- 1150false
- 2110false
- 3140true
- 4160false
- 5120false
- Show AnswerHide Answer
- Workspace
- SingleChoice