Data Interpretation Questions Practice Question and Answer
8 Q:Directions: Study the Bar diagram carefully and answer the questions.
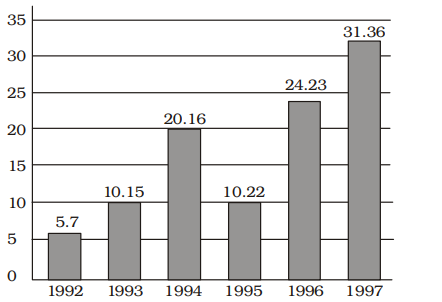
The Bar diagram shows the trends of foreign direct investment (FDI) into India from all over the World (in Rs. crores).

The ratio of investment in 1997 to the average investment is
387 063a56accbe1dca1b35d2e916
63a56accbe1dca1b35d2e916
- 12 : 1true
- 21 : 2false
- 31 : 1false
- 43 : 1false
- Show AnswerHide Answer
- Workspace
- SingleChoice
Answer : 1. "2 : 1"
Q:Directions: Study the Bar diagram carefully and answer the questions.
The Bar diagram shows the trends of foreign direct investment (FDI) into India from all over the World (in Rs. crores).

The year which exhibited the 2nd highest growth percentage in FDI in India over the period shown is
377 063a56a668fc9692134068b08
63a56a668fc9692134068b08
- 11993false
- 21994false
- 31997false
- 41996true
- Show AnswerHide Answer
- Workspace
- SingleChoice
Answer : 4. "1996"
Q:Directions: Study the Bar diagram carefully and answer the questions.
The Bar diagram shows the trends of foreign direct investment (FDI) into India from all over the World (in Rs. crores).

The sum of FDI of 1992 and 1993 is
434 063a569f024e8fb08b9fe1729
63a569f024e8fb08b9fe1729
- 1Rs. 15.58 croresfalse
- 2Rs. 15.85 crorestrue
- 3Rs. 15.22 croresfalse
- 4Rs. 15.65 croresfalse
- Show AnswerHide Answer
- Workspace
- SingleChoice
Answer : 2. "Rs. 15.85 crores "
Q:Directions : Study the following graph and answer the questions.

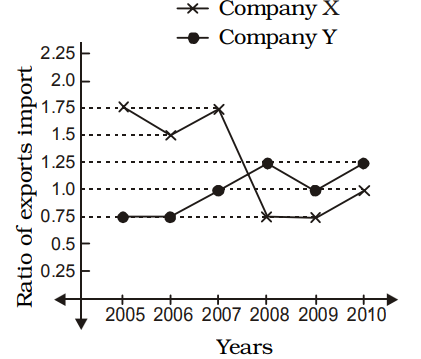
In 2005, the exports of company X were double that of company Y in that year. If the imports of company X during the year were 180 crores, what was the amount (in crore) of imports of company Y during the year?
381 063a5564424e8fb08b9fd64c7
63a5564424e8fb08b9fd64c7
- 1212false
- 2210true
- 3315false
- 4282false
- Show AnswerHide Answer
- Workspace
- SingleChoice
Answer : 2. "210 "
Q:Directions : Study the following graph and answer the questions.

If the imports of company X in 2007 were increased by 40%, what would be the ratio of exports to the increased imports?
337 063a555ecbe1dca1b35d20e06
63a555ecbe1dca1b35d20e06
- 11.25true
- 21.75false
- 30.25false
- 40.75false
- Show AnswerHide Answer
- Workspace
- SingleChoice
Answer : 1. "1.25 "
Q:Directions: Study the following data and answer the questions.
The score of students of a class are given as follows :

The number of students whose IQ score is 100 and more is
680 0639322929dda13791d75358f
639322929dda13791d75358f- 129false
- 235true
- 336false
- 446false
- Show AnswerHide Answer
- Workspace
- SingleChoice
Answer : 2. "35 "
Q:Directions: Study the following data and answer the questions.
The score of students of a class are given as follows :

Number of students whose IQ score is 140 is
609 0639322499dda13791d753497
639322499dda13791d753497- 1undeterminable from given datatrue
- 22false
- 31false
- 40false
- Show AnswerHide Answer
- Workspace
- SingleChoice
Answer : 1. "undeterminable from given data "
Q:Directions : Study the following frequency polygon and answer the questions. Given a line graph showing the number of students passed in Higher Secondary Examination in a school over the years 2008 to 2013.

The decrease in percentage of passed students from 2011 to 2012 approximately is
496 0639321a558400a550de27e18
639321a558400a550de27e18- 18.25%false
- 28.27%false
- 38.24%true
- 48.22%false
- Show AnswerHide Answer
- Workspace
- SingleChoice

