Data Interpretation Questions Practice Question and Answer
8 Q:Directions: Study the bar-graph given below & answer the questions.
Pie-chart given below shows the percentage distribution of total no. of boys in six different Schools.
Total Boys in all schools together = 6400
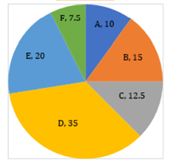
If number of boys in school A and school D together is 2/5 th of the total students in both schools then find difference of girls in school A and school D?
1296 05e93e0269255c93bdf026898
5e93e0269255c93bdf026898Pie-chart given below shows the percentage distribution of total no. of boys in six different Schools.
Total Boys in all schools together = 6400
- 1820false
- 2680false
- 3520false
- 4Cannot be determinedtrue
- 5None of thesefalse
- Show AnswerHide Answer
- Workspace
- SingleChoice
Answer : 4. "Cannot be determined"
Q:Study the following bar chart and answer the questions carefully.
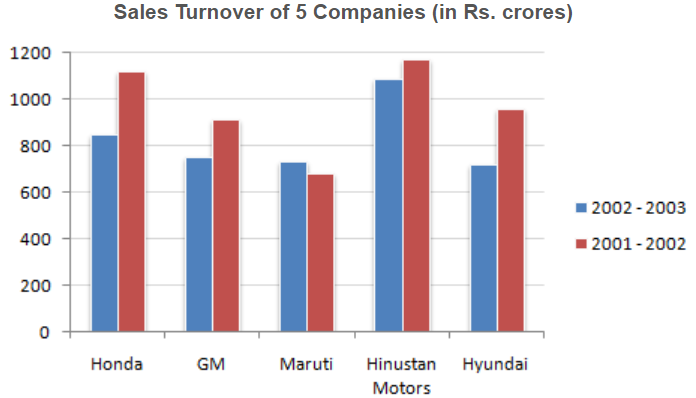
What is the approximate difference between the average sales turnover of all the companies put together between the years 2001 - 2002 and 2002 - 2003 ?
1294 05fd34333531d336d4b4e9e07
5fd34333531d336d4b4e9e07- 1133.45false
- 2142.48true
- 3117.6false
- 4115.25false
- 5None of thesefalse
- Show AnswerHide Answer
- Workspace
- SingleChoice
Answer : 2. "142.48"
Q:Study the graphs to answer these questions.
The pie chart shows the percentage of graduate employees in various department of M/S XYZ limited.
The employees in various departments of M/S. XYZ limited. Other than graduate employees are those employees who are either post graduate or undergraduates.

What percentage of other than graduate employees are there in Marketing and Planning department together?
1285 060113e91af82aa3010a29948
60113e91af82aa3010a29948The pie chart shows the percentage of graduate employees in various department of M/S XYZ limited.
The employees in various departments of M/S. XYZ limited. Other than graduate employees are those employees who are either post graduate or undergraduates.
- 155.5%false
- 275.5%false
- 377.5%true
- 467.5%false
- Show AnswerHide Answer
- Workspace
- SingleChoice
Answer : 3. "77.5%"
Q:Directions: The bar graph given below shows the spending of family income on various items and savings during 1993. Observe the graph and answer the following questions:
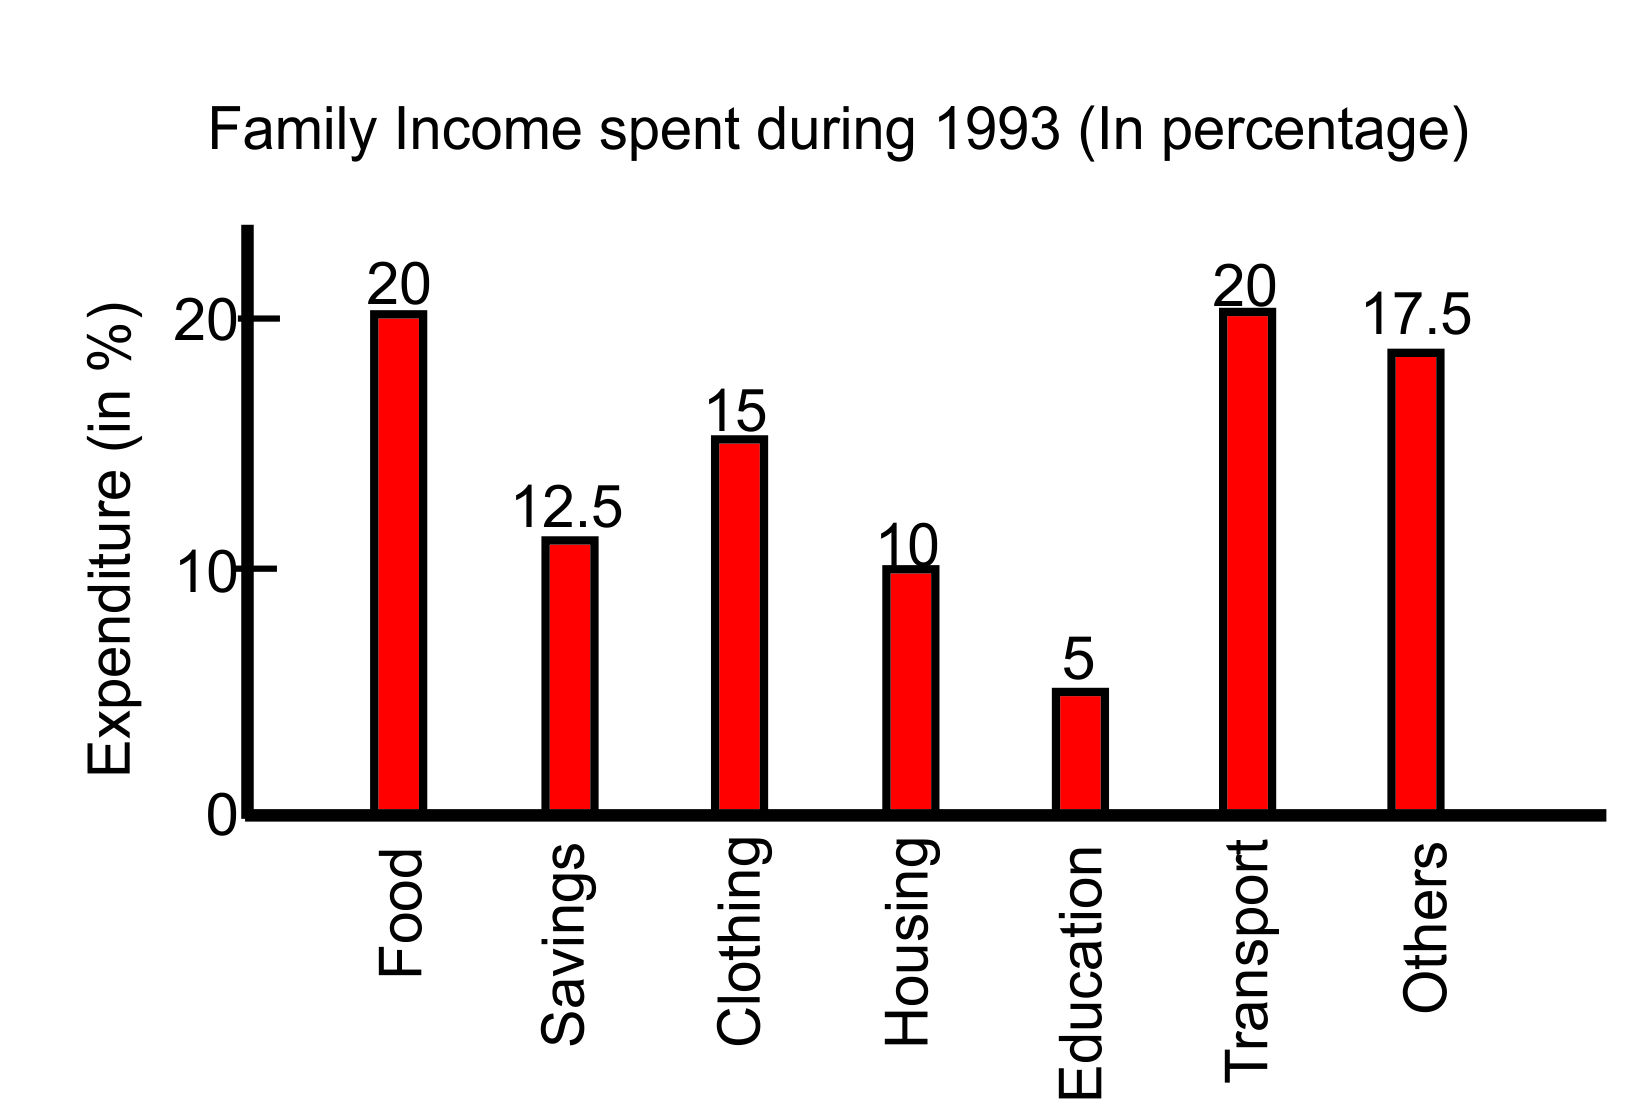
The total expenses of the family on transport is equal to those spent on:
1285 05def3eea806c5b05d54f2644
5def3eea806c5b05d54f2644- 1savingsfalse
- 2clothingfalse
- 3foodtrue
- 4othersfalse
- Show AnswerHide Answer
- Workspace
- SingleChoice
Answer : 3. "food "
Q:Direction: Study the following graph and answer the questions based on it.
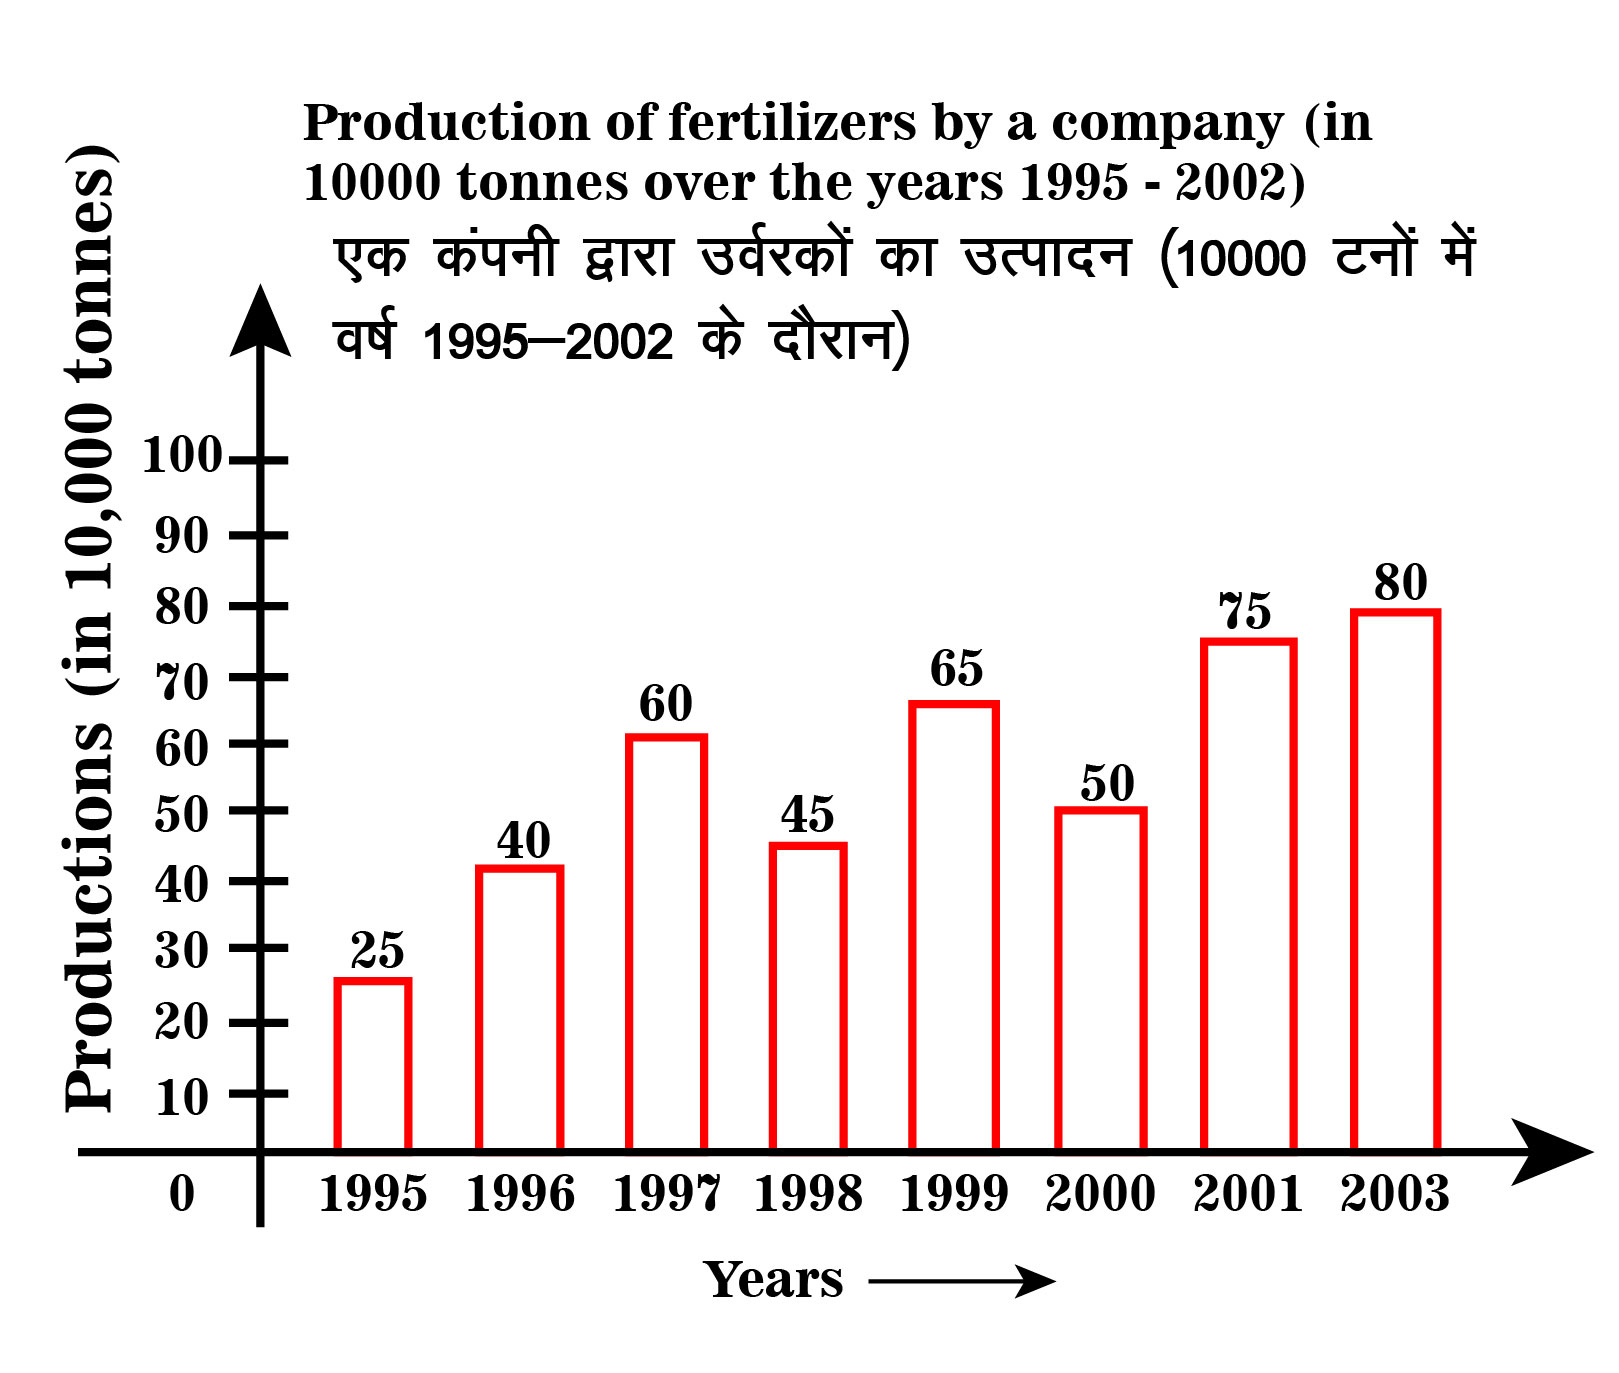
The ratio of total production of fertilizers in the year 1996 and 1997 to that of total production in the year 1995, 1998 and 2000 is
1281 05ea817103b50714be9b2441f
5ea817103b50714be9b2441f- 15 : 6true
- 26 : 5false
- 320 : 29false
- 413: 24false
- 5None of thesefalse
- Show AnswerHide Answer
- Workspace
- SingleChoice
Answer : 1. "5 : 6"
Q:Directions : A graph showing the price of rice in India during the year 2000 to 2003 is given below. Study the graph carefully and answer the questions.

For the month of May, the graph shows that the price of rice was the lowest in the year
1281 06391d74fb13d3250d3268a91
6391d74fb13d3250d3268a91- 12000false
- 22001false
- 32002false
- 42003true
- Show AnswerHide Answer
- Workspace
- SingleChoice
Answer : 4. "2003"
Q:The pie chart given below shows the number of shoes of 5 different brands in a multi brand store. There are total 1200 shoes.
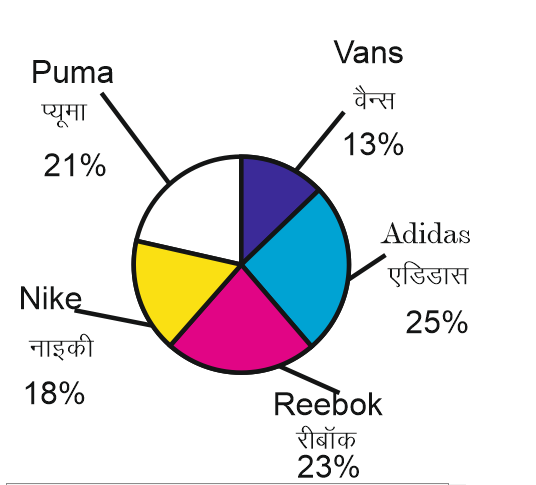
What is the difference in number of shoes of Puma and Vans?
1275 05efeb436eb90be58c5960fed
5efeb436eb90be58c5960fed- 196true
- 2156false
- 3187false
- 4112false
- Show AnswerHide Answer
- Workspace
- SingleChoice
Answer : 1. "96"
Q:Direction: Study the following graph and answer the questions based on it.
In which year was the percentage increase in production as compared to the previous year, the maximum?
1275 05ea816c4c8dec64c0097e00b
5ea816c4c8dec64c0097e00b- 12002false
- 22001false
- 31996true
- 41997false
- 5None of thesefalse
- Show AnswerHide Answer
- Workspace
- SingleChoice