Data Interpretation Questions Practice Question and Answer
8 Q:Directions: The table given here shows the production of five types of cars by a company in the year 1989 to 1994. Study the table and answer questions.
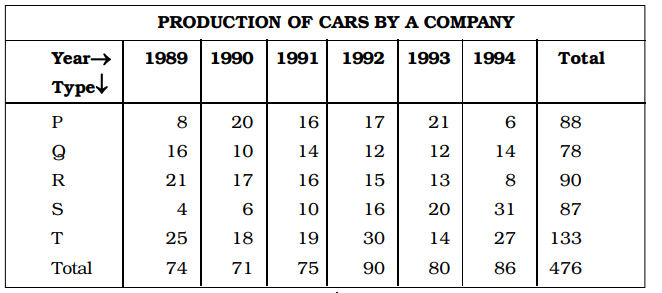
In which year the production of
cars of all types taken together
was approximately equal to the
average of the total production
during the period?
647 0632daf605c208a6bf7f2631a
632daf605c208a6bf7f2631a
- 11989false
- 21991false
- 31993true
- 41994false
- Show AnswerHide Answer
- Workspace
- SingleChoice
Answer : 3. "1993 "
Q:Directions: Study the graph carefully and answer the following questions.
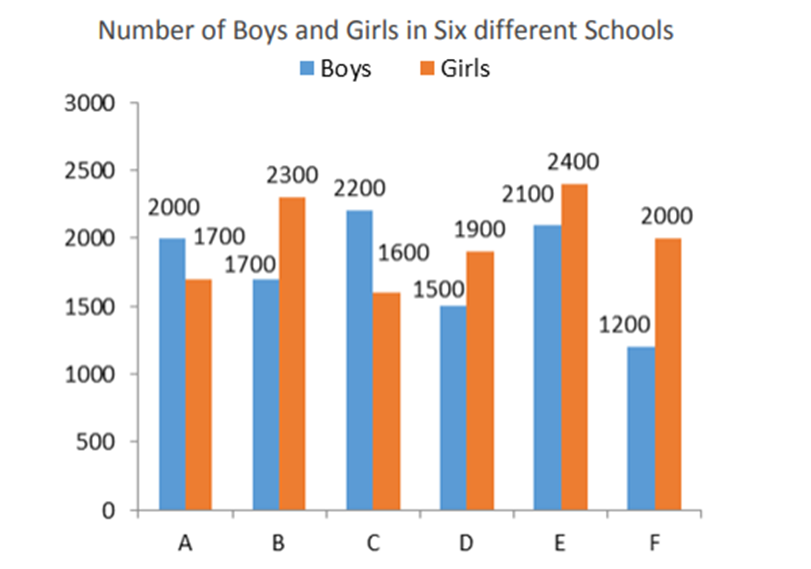
Find the respective ratio of the number of students in school D and school F.
617 062c3fa9495b7933e5332909f
62c3fa9495b7933e5332909f
- 115 : 14false
- 214 : 15false
- 317 : 16true
- 416 : 17false
- 5None of thesefalse
- Show AnswerHide Answer
- Workspace
- SingleChoice
Answer : 3. "17 : 16 "
Q:Direction: The bar graph shows revenues in rupees lakhs from selling four different products (A, B, C and D) by a certain company. Study the diagram and answer the following questions.
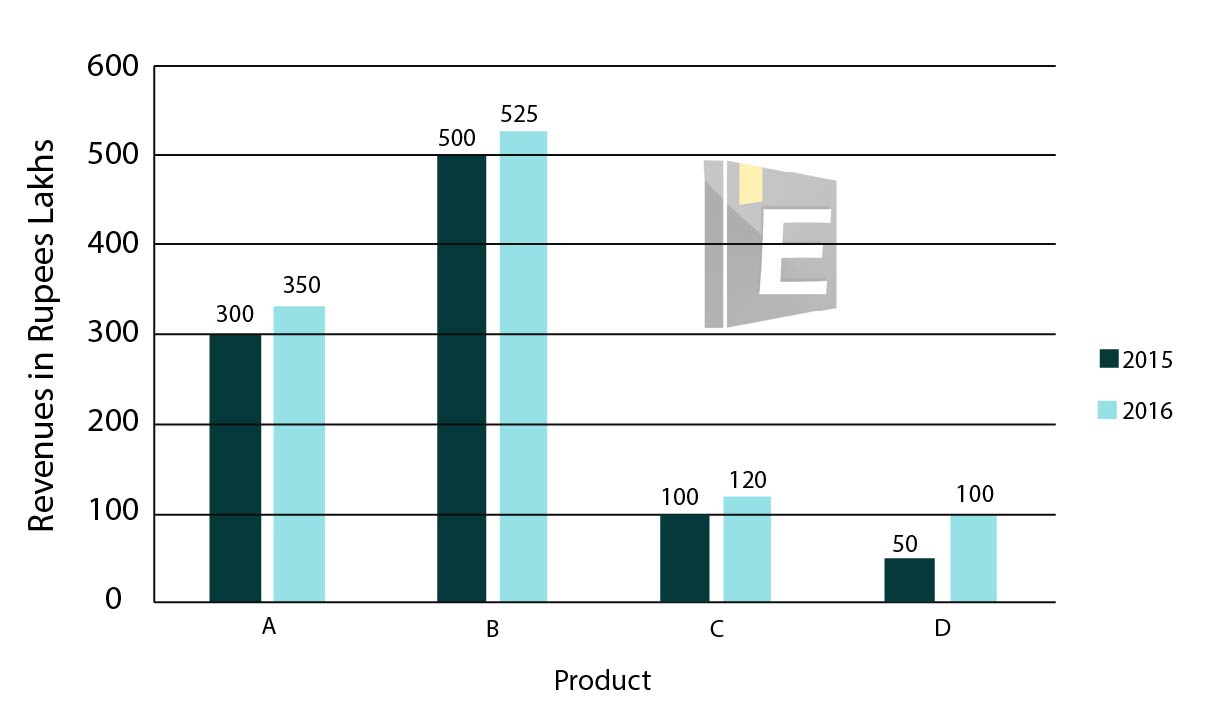
By what value (in %) the revenue from sale of product B in 2016 was greater than that of 2015?
758 0619f6879d129fc6243ae9488
619f6879d129fc6243ae9488
- 10.5false
- 25true
- 325false
- 425false
- Show AnswerHide Answer
- Workspace
- SingleChoice
Answer : 2. "5"
Q:Direction: The bar graph shows revenues in rupees lakhs from selling four different products (A, B, C and D) by a certain company. Study the diagram and answer the following questions.

Revenues from which product were the least in both the years 2015 and 2016?
730 0619f627bc1c85f0fbf506cd9
619f627bc1c85f0fbf506cd9
- 1Afalse
- 2Bfalse
- 3Cfalse
- 4Dtrue
- Show AnswerHide Answer
- Workspace
- SingleChoice
Answer : 4. "D"
Q:Study the following table and answer the equation:
Number of cars sold by dealers A, B, C, D and E during first six
months of 2018.
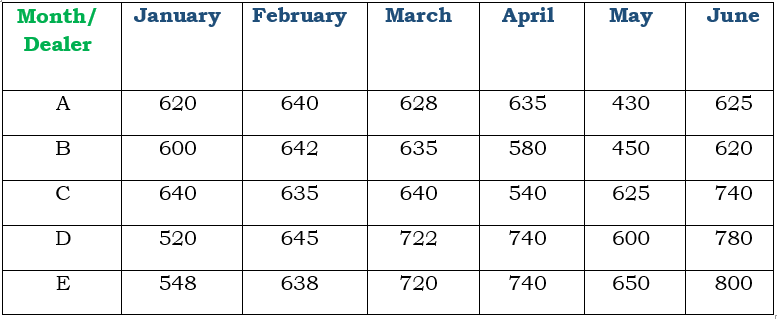
In July 2018, if the sales of cars by the dealer D increases by the same percentage as in June 2018 over its previous month, then what is the number of cars sold by D in July 2018 ?
926 0619e09272f80a134c81c10c4
619e09272f80a134c81c10c4Number of cars sold by dealers A, B, C, D and E during first six months of 2018.

- 11014true
- 2975false
- 31020false
- 4959false
- Show AnswerHide Answer
- Workspace
- SingleChoice
Answer : 1. "1014 "
Q:Study the following table and answer the equation:
Number of cars sold by dealers A, B, C, D and E during first six
months of 2018.

The ratio of the total number of cars sold by dealer B in January, April and June to the total number of cars sold by dealers A and D in March is:
931 0619e08c6925df30febf07d0e
619e08c6925df30febf07d0eNumber of cars sold by dealers A, B, C, D and E during first six months of 2018.

- 18:9false
- 27:5false
- 34:3true
- 410:9false
- Show AnswerHide Answer
- Workspace
- SingleChoice
Answer : 3. "4:3 "
Q:Direction: Study the following graph carefully and answer the following questions.
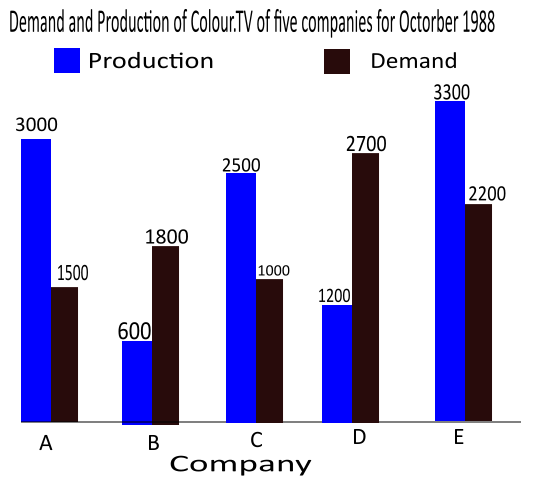
What is the ratio of companies having more demand than production to those having more production than demand?
844 060069c2744bc07148778f544
60069c2744bc07148778f544
- 14 :1false
- 23 : 2false
- 32 : 3true
- 42 : 2false
- Show AnswerHide Answer
- Workspace
- SingleChoice
Answer : 3. "2 : 3"
Q: The bar graph shows the number of painting sold an art gallery in each month from January to June.
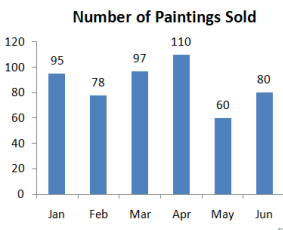
How many paintings does it need to sell in July for the 7 month average to be 90?
1229 060c09eb2c197293a48276046
60c09eb2c197293a48276046
- 1115false
- 285false
- 390false
- 4110true
- Show AnswerHide Answer
- Workspace
- SingleChoice

