Data Interpretation Questions Practice Question and Answer
8 Q:Study the graphs to answer these questions.
The pie chart shows the percentage of graduate employees in various department of M/S XYZ limited.
The employees in various departments of M/S. XYZ limited. Other than graduate employees are those employees who are either post graduate or undergraduates.

Number of other than graduate employees in Finance and Planning departments together is what percent greater than number of graduate employees in Administration department? (Approx)
653 06011434caf82aa3010a2ec37
6011434caf82aa3010a2ec37The pie chart shows the percentage of graduate employees in various department of M/S XYZ limited.
The employees in various departments of M/S. XYZ limited. Other than graduate employees are those employees who are either post graduate or undergraduates.

- 1933%true
- 2666%false
- 3533%false
- 4833 %false
- Show AnswerHide Answer
- Workspace
- SingleChoice
Answer : 1. "933% "
Q:Study the graphs to answer these questions.
The pie chart shows the percentage of graduate employees in various department of M/S XYZ limited.
The employees in various departments of M/S. XYZ limited. Other than graduate employees are those employees who are either post graduate or undergraduates.

The number of graduate employees in Administration and Production together is how many times other than graduate employees in Marketing and Finance together?
772 060114302af82aa3010a2ea48
60114302af82aa3010a2ea48The pie chart shows the percentage of graduate employees in various department of M/S XYZ limited.
The employees in various departments of M/S. XYZ limited. Other than graduate employees are those employees who are either post graduate or undergraduates.

- 13.5false
- 20.285true
- 30.445false
- 40.215false
- Show AnswerHide Answer
- Workspace
- SingleChoice
Answer : 2. "0.285 "
Q:Study the graphs to answer these questions.
The pie chart shows the percentage of graduate employees in various department of M/S XYZ limited.
The employees in various departments of M/S. XYZ limited. Other than graduate employees are those employees who are either post graduate or undergraduates.

What percentage of other than graduate employees are there in Marketing and Planning department together?
978 060113e91af82aa3010a29948
60113e91af82aa3010a29948The pie chart shows the percentage of graduate employees in various department of M/S XYZ limited.
The employees in various departments of M/S. XYZ limited. Other than graduate employees are those employees who are either post graduate or undergraduates.

- 155.5%false
- 275.5%false
- 377.5%true
- 467.5%false
- Show AnswerHide Answer
- Workspace
- SingleChoice
Answer : 3. "77.5%"
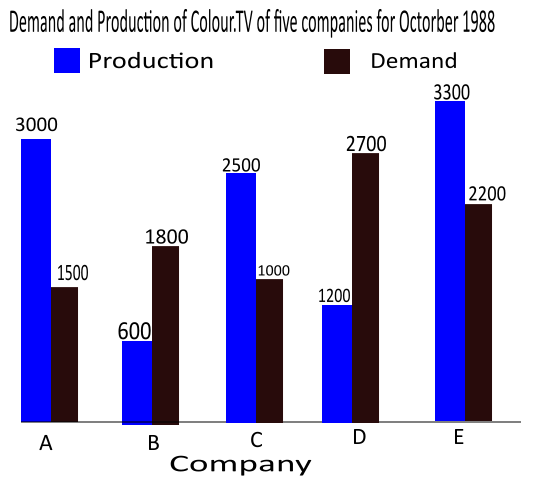
Q:Direction: Study the following graph carefully and answer the following questions.

What is the difference between average demand and average production of the five companies taken together?
872 060069d987a0c6e1017e04e41
60069d987a0c6e1017e04e41
- 1400false
- 2138false
- 31400false
- 4280true
- Show AnswerHide Answer
- Workspace
- SingleChoice
Answer : 4. "280"
Q:Direction: Study the following graph carefully and answer the following questions.

The production of company D is approximately how many time that of the production of company A?
775 060069b787a0c6e1017e04b44
60069b787a0c6e1017e04b44
- 11.5false
- 21.11false
- 31.8true
- 42.5false
- Show AnswerHide Answer
- Workspace
- SingleChoice
Answer : 3. "1.8"
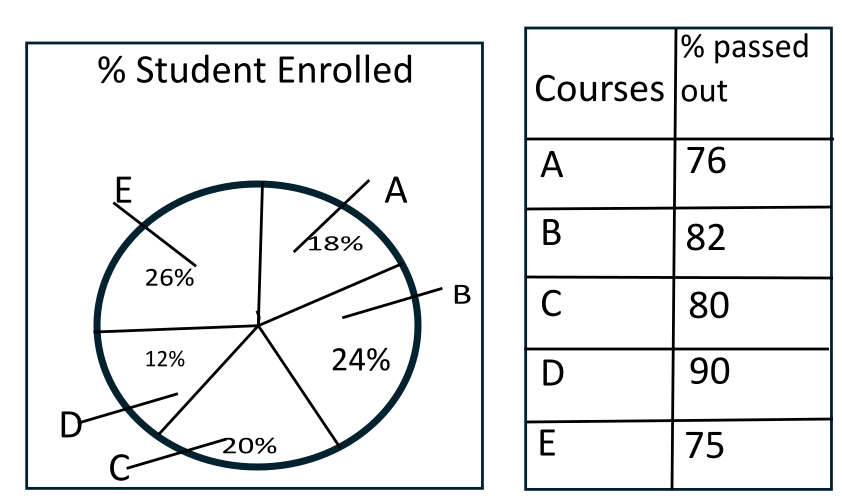
Q:The given pie chart shows the percentage of students enrolled for the courses A, B, C, D and E in a university and the table shows the percentage of students that passed, out of the enrolled students.
Total Students=60,000

What is the ratio of Passed student in A and B ?
1042 05ffc35c1b78a0253d6ee66ff
5ffc35c1b78a0253d6ee66ffTotal Students=60,000

- 156 : 43false
- 257 : 82true
- 351 : 41false
- 447 : 67false
- Show AnswerHide Answer
- Workspace
- SingleChoice
Answer : 2. "57 : 82"
Q:The given pie chart shows the percentage of students enrolled for the courses A, B, C, D and E in a university and the table shows the percentage of students that passed, out of the enrolled students.
Total Students=60,000

How many students passed in Course C?
694 05ffc357323210f22f33037a7
5ffc357323210f22f33037a7Total Students=60,000

- 18800false
- 29600true
- 37300false
- 46800false
- Show AnswerHide Answer
- Workspace
- SingleChoice
Answer : 2. "9600"
Q:The given pie chart shows the percentage of students enrolled for the courses A, B, C, D and E in a university and the table shows the percentage of students that passed, out of the enrolled students.
Total Students=60,000

How many students passed in Course B?
802 05ffc353523210f22f330372a
5ffc353523210f22f330372aTotal Students=60,000

- 12512false
- 22490true
- 32392false
- 42592false
- Show AnswerHide Answer
- Workspace
- SingleChoice

