Data Interpretation Questions Practice Question and Answer
8 Q:Direction: Study the line graph carefully to answer the following questions.
Line graph shows the production (in thousand units) and percentage of exported mobiles, computers and laptops.
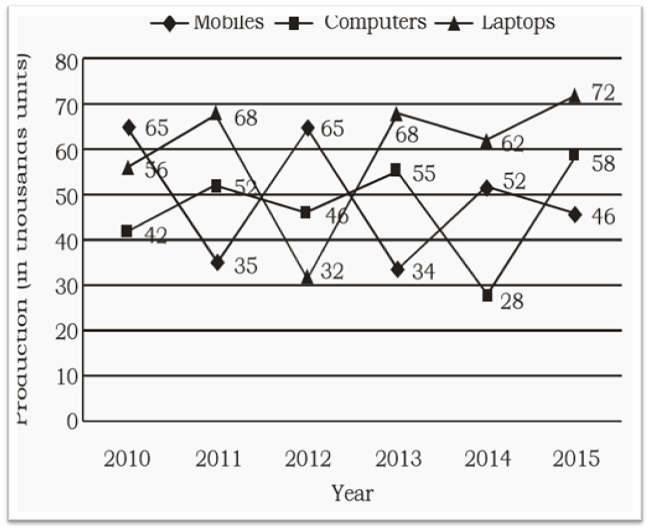
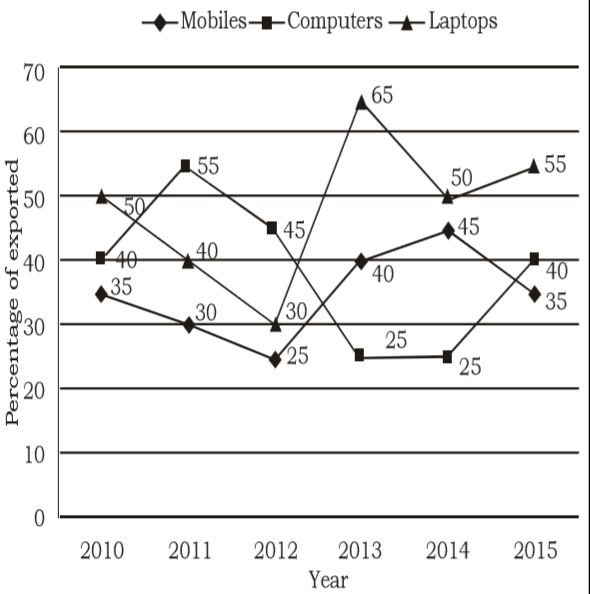
If the ratio between export prices of Mobiles, Laptops and Computers are 2: 1: 1.5 in the year 2014, then what is the proportion of their export earnings?
1048 05e9d1ea3bf0a265d837b90df
5e9d1ea3bf0a265d837b90dfLine graph shows the production (in thousand units) and percentage of exported mobiles, computers and laptops.
- 1454 : 232 : 213false
- 2476 : 210: 213false
- 3468 : 310: 105true
- 4cannot be determinedfalse
- 5None of thesefalse
- Show AnswerHide Answer
- Workspace
- SingleChoice
Answer : 3. "468 : 310: 105"
Q:Directions: Study the following pie chart carefully and answer the questions given beside.
The following pie chart gives the information about breakup of six different categories of workers in a company.
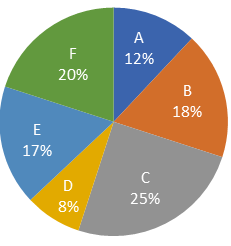
If total 1800 workers are working in the company then find the absolute difference between the number of workers in category D and category C?
1044 0601a56da8f9c7c5b6d8f3b8b
601a56da8f9c7c5b6d8f3b8bThe following pie chart gives the information about breakup of six different categories of workers in a company.
- 1323false
- 2306true
- 3289false
- 4286false
- Show AnswerHide Answer
- Workspace
- SingleChoice
Answer : 2. "306"
Q:Study the graphs to answer these questions.
The pie chart shows the percentage of graduate employees in various department of M/S XYZ limited.
The employees in various departments of M/S. XYZ limited. Other than graduate employees are those employees who are either post graduate or undergraduates.

The number of graduate employees in Administration and Production together is how many times other than graduate employees in Marketing and Finance together?
1043 060114302af82aa3010a2ea48
60114302af82aa3010a2ea48The pie chart shows the percentage of graduate employees in various department of M/S XYZ limited.
The employees in various departments of M/S. XYZ limited. Other than graduate employees are those employees who are either post graduate or undergraduates.
- 13.5false
- 20.285true
- 30.445false
- 40.215false
- Show AnswerHide Answer
- Workspace
- SingleChoice
Answer : 2. "0.285 "
Q:The following penalty diagram shows the 4 year exam results of the students of 10th standard. Study the diagram and answer the following questions.
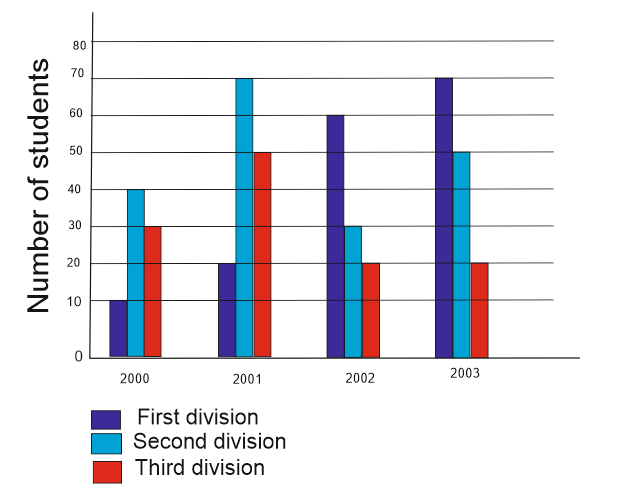
What is the ratio of the total students who have attained second division in the year 2000 and appeared in the examination?
1042 05dd4def57780ee3551584a51
5dd4def57780ee3551584a51- 11:4true
- 21:3false
- 33:4false
- 41:2false
- Show AnswerHide Answer
- Workspace
- SingleChoice
Answer : 1. "1:4"
Q:Directions: The bar graph shows the results of an annual examination in a secondary school in a certain year. Answer the following four questions based on this chart.

The ratio of the total number of boys passed to the total number of girls passed in the three classes VII, VIII and IX is
1041 05e8afb7167af633f22bd755c
5e8afb7167af633f22bd755c- 119 : 25false
- 221 : 26false
- 320 : 23true
- 418 : 21false
- Show AnswerHide Answer
- Workspace
- SingleChoice
Answer : 3. "20 : 23"
Q:The line graph shows the number of vacancies of accountants in a certain company. Study the diagram and answer the following questions.
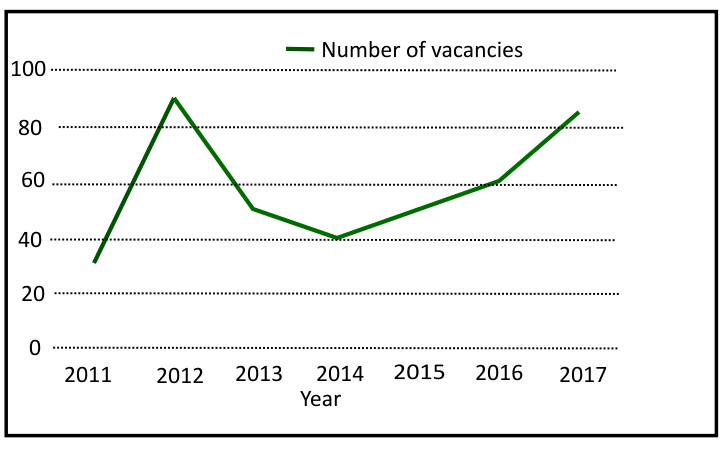
What is the average of the total vacancies?
1041 05f5b0f7769ed13038c1a9a5f
5f5b0f7769ed13038c1a9a5f- 158.58false
- 258.57true
- 360false
- 455false
- Show AnswerHide Answer
- Workspace
- SingleChoice
Answer : 2. "58.57"
Q:The table given below shows the information about bats manufactured by 6 different companies. Each company manufactures only plastic and wooden bats. Each company labels these bats as Brand A or Brand B. The table shows the number of plastic bats as a percentage of total bats manufactured by each company. It also shows the ratio of wooden bats labelled A and B. Each company manufactured a total 550000 bats.

P=sum of wooden bats of Brand B manufactured by S and wooden bats of Brand A manufactured by W.
Q= Difference of Brand B wooden bats and Brand A wooden bats manufactured by U.
What is the value of P - Q ?
1039 05f30d80ebcbb69394d1c9f66
5f30d80ebcbb69394d1c9f66Q= Difference of Brand B wooden bats and Brand A wooden bats manufactured by U.
What is the value of P - Q ?
- 167,500false
- 217,7700false
- 315,9500true
- 412,3500false
- Show AnswerHide Answer
- Workspace
- SingleChoice
Answer : 3. "15,9500"
Q: The bar graph shows the number of passports issued in a country in 6 consecutive years.
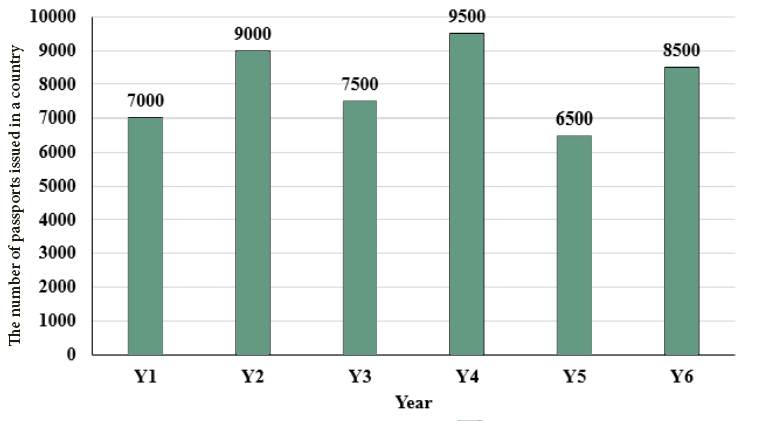
What is the average number of passports issued per year?
1038 06450cd6139143d085f370f7d
6450cd6139143d085f370f7d- 111200false
- 27600false
- 38000true
- 412000false
- Show AnswerHide Answer
- Workspace
- SingleChoice