Data Interpretation Questions Practice Question and Answer
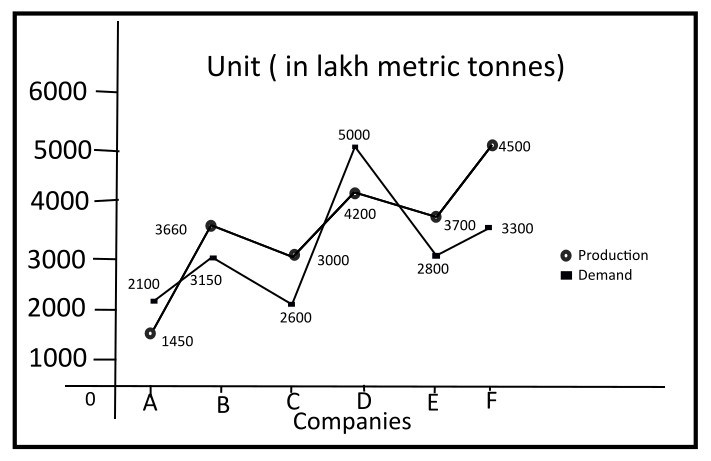
8 Q:Directions : The graph shows the demand and production of different companies. Study the graph and answer the following questions.

The demand of company B is what percentage of the production of company F ?
1117 05f4f72000c72eb2349336a22
5f4f72000c72eb2349336a22
- 150%false
- 270%true
- 380%false
- 460%false
- Show Answer
- Workspace
- SingleChoice
Answer : 2. "70%"
Q:Directions : The graph shows the demand and production of different companies. Study the graph and answer the following questions.

What is the ratio of companies with high demand to production and companies with less than production?
861 05f4f71b87e85226ee74c45d7
5f4f71b87e85226ee74c45d7
- 11:2true
- 22:3false
- 32:1false
- 43:2false
- Show Answer
- Workspace
- SingleChoice
Answer : 1. "1:2"
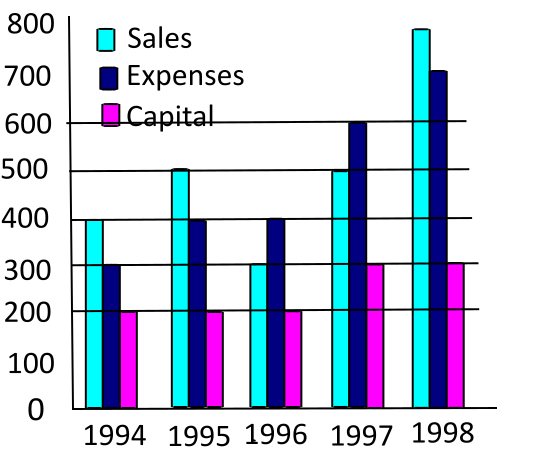
Q:Directions: The following graph gives Sales, Expense and Capital of a company for a period of five years 1994 to 1998. Read the graph and answer the following questions.

In which year was the ratio of sales to capital the lowest?
933 05f40e6549b782961da3f964a
5f40e6549b782961da3f964a
- 11998false
- 21997false
- 31996true
- 41995false
- Show Answer
- Workspace
- SingleChoice
Answer : 3. "1996"
Q:Directions: The following graph gives Sales, Expense and Capital of a company for a period of five years 1994 to 1998. Read the graph and answer the following questions.

In which year was the ratio of profits to capital the highest?
911 05f40e5d69b782961da3f9518
5f40e5d69b782961da3f9518
- 11998false
- 21995true
- 31996false
- 41997false
- Show Answer
- Workspace
- SingleChoice
Answer : 2. "1995"
Q:Directions: The following graph gives Sales, Expense and Capital of a company for a period of five years 1994 to 1998. Read the graph and answer the following questions.

What was the average per annum increase in sales (in Rs. Cr.) from 1994 to 1998?
932 05f40e3984c9a9415f7ce2acd
5f40e3984c9a9415f7ce2acd
- 150false
- 260false
- 380true
- 4100false
- Show Answer
- Workspace
- SingleChoice
Answer : 3. "80"
Q:Directions: The following graph gives Sales, Expense and Capital of a company for a period of five years 1994 to 1998. Read the graph and answer the following questions.

In which year was the Sales to Expense ratio the lowest?
918 05f40e2e89b782961da3f873c
5f40e2e89b782961da3f873c
- 11994false
- 21996true
- 31997false
- 41998false
- Show Answer
- Workspace
- SingleChoice
Answer : 2. "1996"
Q:Directions: The following graph gives Sales, Expense and Capital of a company for a period of five years 1994 to 1998. Read the graph and answer the following questions.

What has been the simple average growth rate per annum of expense between 1994 and 1998?
1226 05f40e287b8958f14fa2b6472
5f40e287b8958f14fa2b6472
- 125%true
- 233%false
- 340%false
- 4130%false
- Show Answer
- Workspace
- SingleChoice
Answer : 1. "25%"
Q:The table given below shows the information about bats manufactured by 6 different companies. Each company manufactures only plastic and wooden bats. Each company labels these bats as Brand A or Brand B. The table shows the number of plastic bats as a percentage of total bats manufactured by each company. It also shows the ratio of wooden bats labelled A and B. Each company manufactured a total 550000 bats.

X= Average of plastic bats manufactured by V, U and T.
Y=Wooden bats of Brand A manufactured by V.
What is the value X – Y?
1263 05f30d8dfbcbb69394d1ca4d8
5f30d8dfbcbb69394d1ca4d8
Y=Wooden bats of Brand A manufactured by V.
What is the value X – Y?
- 1197600false
- 2432890false
- 3260000true
- 4293300false
- Show Answer
- Workspace
- SingleChoice

