Data Interpretation Questions Practice Question and Answer
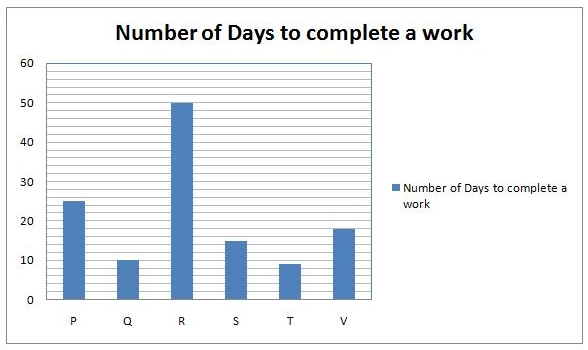
8 Q:Study the following graph carefully to answer the given questions

The efficiency of L is 25% more than P. L started a work alone and then P joined her 5 days before actual completion of the work. For how many days L worked alone?
1099 05ea9405b07542b13ae2c1662
5ea9405b07542b13ae2c1662
- 19false
- 211true
- 310false
- 425false
- 512false
- Show AnswerHide Answer
- Workspace
- SingleChoice
Answer : 2. "11"
Q:Study the following graph carefully to answer the given questions

Q and S work together for 5 days, the rest of the work is finished by M in two more days. If they get Rs. 6000 as wages for the whole work, what are the daily wages of Q, S and M respectively?
1089 05ea93fce3dbbdc76195ad9b3
5ea93fce3dbbdc76195ad9b3
- 1200, 250, 300false
- 2300, 200, 250false
- 3600, 400, 200false
- 4600, 400, 500true
- 5None of thesefalse
- Show AnswerHide Answer
- Workspace
- SingleChoice
Answer : 4. "600, 400, 500"
Q:Study the following graph carefully to answer the given questions

P and R started the work jointly. A few days later U also joined them and thus all of them completed the whole work in 10 days. All of them were paid total Rs.600. What is the Share of U?
1432 05ea93f53f197950c155cb511
5ea93f53f197950c155cb511
- 1Rs.360false
- 2Rs.385false
- 3Rs.240true
- 4can’t be determinedfalse
- 5None of thesefalse
- Show AnswerHide Answer
- Workspace
- SingleChoice
Answer : 3. "Rs.240"
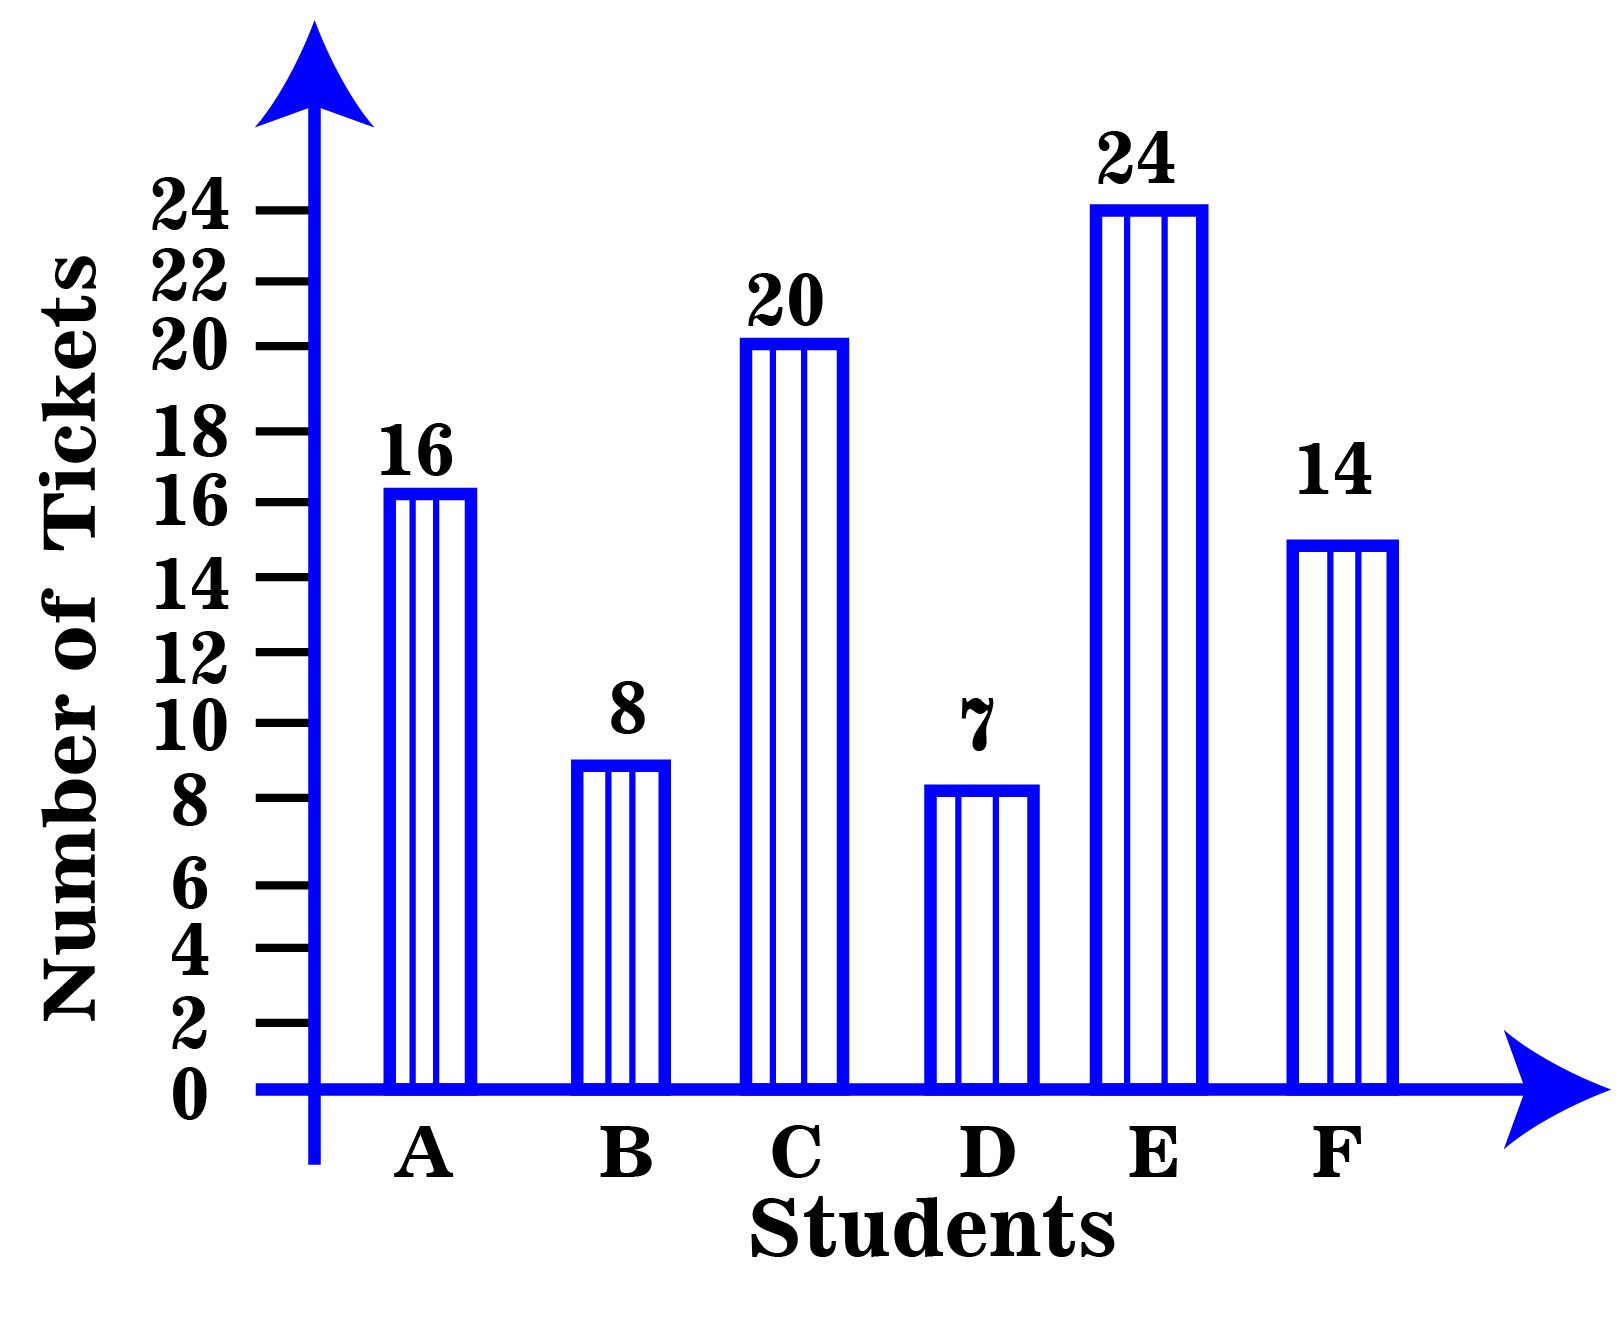
Q:Directions: The bar graph, given here, shows the number of tickets sold by 6 students A, B, C, D, E and F during a fair.

Total number of tickets sold by A, B and C is
2186 05ea81363a63dac4c26cbd00d
5ea81363a63dac4c26cbd00d
- 145false
- 244true
- 342false
- 440false
- 5None of thesefalse
- Show AnswerHide Answer
- Workspace
- SingleChoice
Answer : 2. "44 "
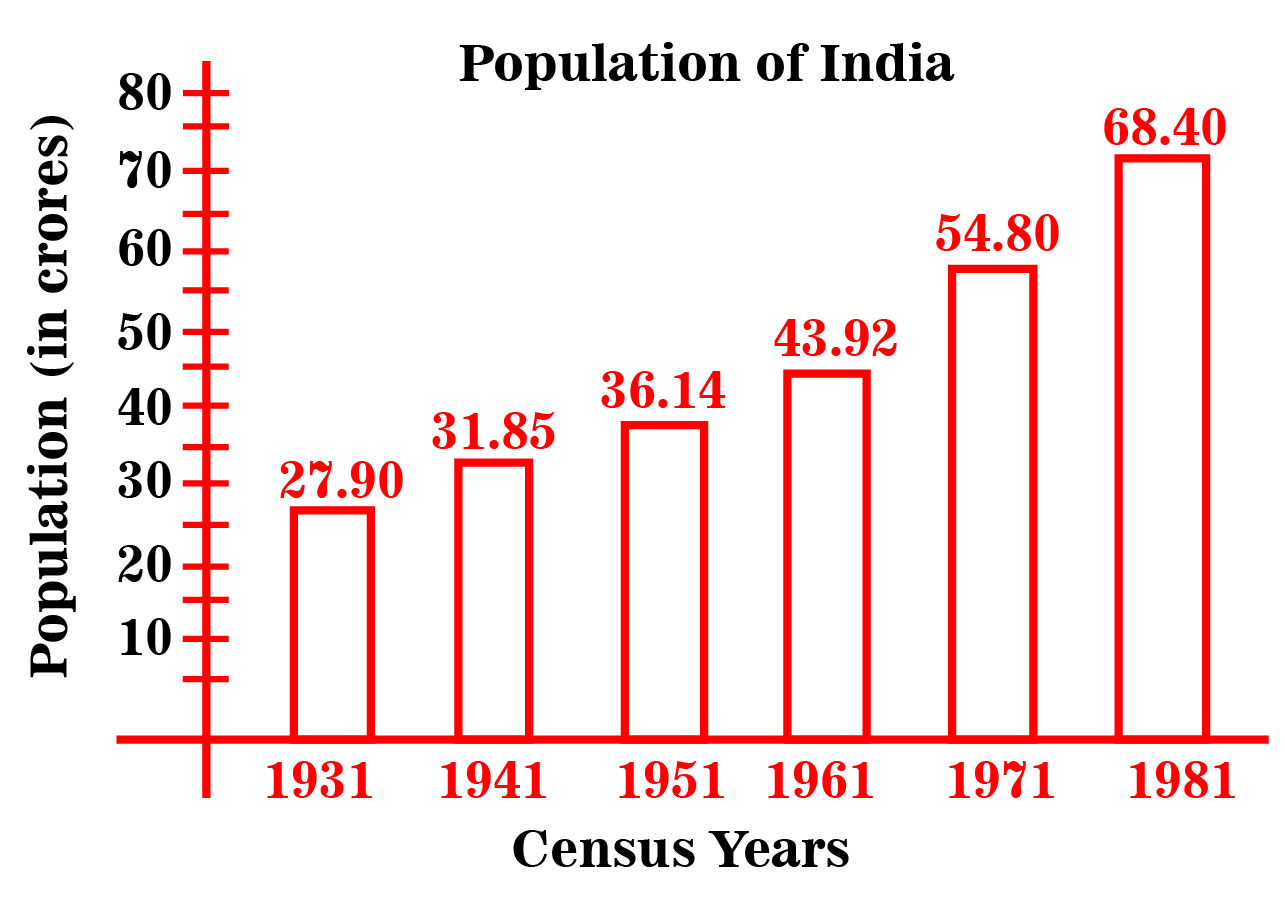
Q:Directions: The Bar Graph given here shows the population (in crores) of India in various census years. Observe the graph and answer the question based on it.

In which census year, the percent increase in population is highest as compared to that in the previous census year?
1558 05ea8113ca63dac4c26cb72b8
5ea8113ca63dac4c26cb72b8
- 11951false
- 21961false
- 31971false
- 41981true
- 5None of thesefalse
- Show AnswerHide Answer
- Workspace
- SingleChoice
Answer : 4. "1981"
Q:Directions: The Bar Graph given here shows the population (in crores) of India in various census years. Observe the graph and answer the question based on it.

In which census year, the percent increase in population is least as compared to that in the previous census year?
1501 05ea811ae3b50714be9b1d5c9
5ea811ae3b50714be9b1d5c9
- 11961false
- 21951true
- 31971false
- 41941false
- 5None of thesefalse
- Show AnswerHide Answer
- Workspace
- SingleChoice
Answer : 2. "1951 "
Q:Directions: The Bar Graph given here shows the population (in crores) of India in various census years. Observe the graph and answer the question based on it.

Per year increase in population from the year 1931 to 1981 is
2892 05ea8124ec8dec64c00978d98
5ea8124ec8dec64c00978d98
- 18100000true
- 27600000false
- 38900000false
- 46700000false
- 5None of thesefalse
- Show AnswerHide Answer
- Workspace
- SingleChoice
Answer : 1. "8100000 "
Q:Directions: The bar graph, given here, shows the number of tickets sold by 6 students A, B, C, D, E and F during a fair.

Which student sold the least tickets?
1137 05ea8144c14fb314c31fe88be
5ea8144c14fb314c31fe88be
- 1Bfalse
- 2Ffalse
- 3Afalse
- 4Dtrue
- 5None of thesefalse
- Show AnswerHide Answer
- Workspace
- SingleChoice

