Data Interpretation Questions Practice Question and Answer
8 Q: The following table shows the number of laptops sold from five different stores in a city on five days of a given week.
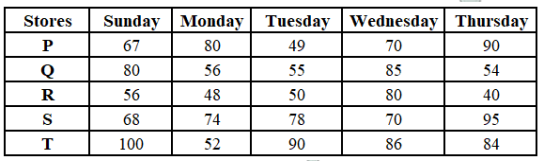
What is the ratio of the total number of computers sold from store S on Tuesday, Monday and Sunday taken together to that sold from store P on Tuesday, Wednesday and Thursday taken together?
872 0642824fcdcb650c14572115f
642824fcdcb650c14572115f- 113 : 11false
- 211 : 15false
- 311 : 19false
- 420 : 19true
- Show AnswerHide Answer
- Workspace
- SingleChoice
Answer : 4. "20 : 19"
Q:Directions: Read the given pie and table carefully and answer the following questions.
The pie chart shows the percentage distribution of people who found COVID – 19 positive in four major cities of India from 1st July to 31st August 2020 and the table shows the number of people who tested positive in July from these cities.
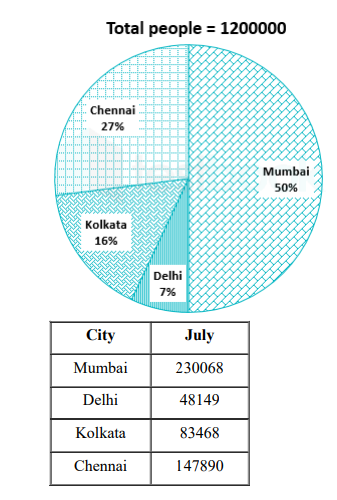
If the recovery rate is 70% and the death rate is 10% of total tested cases in Chennai at the end of July. How many active cases are on 1st August, if no case is found on that day?
871 064f567f490902899fbf4746e
64f567f490902899fbf4746e- 132593false
- 221500false
- 315320false
- 429578true
- 5None of thesefalse
- Show AnswerHide Answer
- Workspace
- SingleChoice
Answer : 4. "29578"
Q: The following pie chart shows the number of bags sold by 7 different shops during a month as percentages of the total number of bags sold during this month by these 7 shops taken together.

If the total number of bags sold during the given month by these 7 shops taken together was 1400, then what was the total number of bags sold by S3 and S 7 taken together?
870 0642ac3aded76c064b863b95b
642ac3aded76c064b863b95b- 1240false
- 2196false
- 3224true
- 4210false
- Show AnswerHide Answer
- Workspace
- SingleChoice
Answer : 3. "224 "
Q:In the following diagram, three different products (in thousands) produced by a company in 5 years are given and after studying them carefully, answer the following questions.
Three products produced by a company in different years (in thousands)
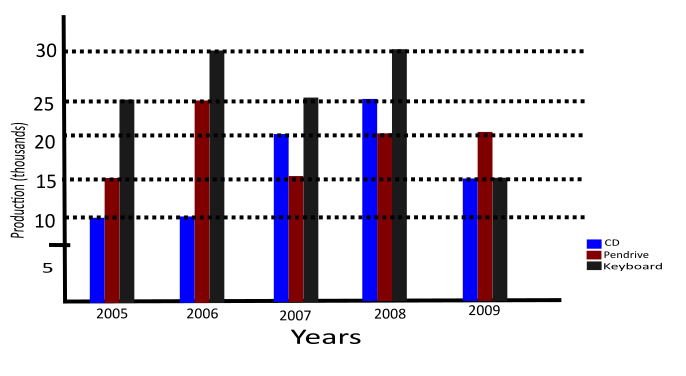
What is the difference between the CD produced between the year 2007 and the year 2009?
870 05faa5dc15ebf3a64427b0eaa
5faa5dc15ebf3a64427b0eaa- 120,000false
- 215,000true
- 35,000false
- 4500false
- Show AnswerHide Answer
- Workspace
- SingleChoice
Answer : 2. "15,000"
Q:Directions : The expenses of a country for a particular year is given in Pie–Chart. Read the Pie– Chart and answer the questions.
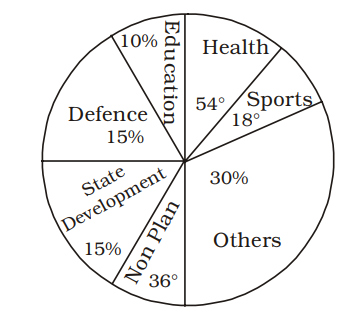
The percent of excess money spent on Others than that on Sports is
867 063ac35174edf0d569930f9f0
63ac35174edf0d569930f9f0- 120%false
- 225%true
- 350%false
- 428%false
- Show AnswerHide Answer
- Workspace
- SingleChoice
Answer : 2. "25%"
Q:Directions : The Bar Graph given here shows the population (in crores) of India in various census years. Observe the graph and answer the question based on it.
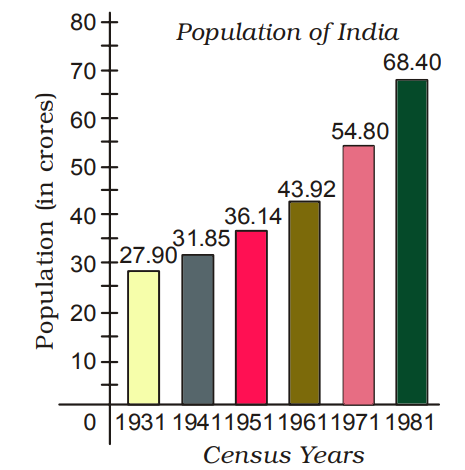
Peryear increase in population from the year 1931 to 1981 is
867 06453aa5613eb5908ae357970
6453aa5613eb5908ae357970- 18100000true
- 27600000false
- 38900000false
- 46700000false
- Show AnswerHide Answer
- Workspace
- SingleChoice
Answer : 1. "8100000 "
Q:Directions: Read the below data carefully and answer the following questions.
The table shows the total number of ice cream (Chocobar + Cornetto) was given by Santa Claus on the day of Xmas to 5 children. It also shows the number of Chocobar ice-creams is how much more or less percentage of the total number of Cornetto ice-creams.
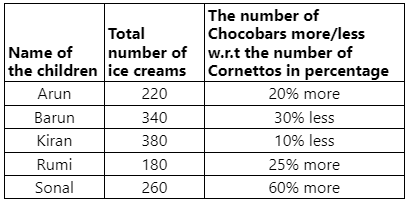
Find the ratio between the total number of Chocobars Arun, Kiran and Rumi have and the total number of Cornetto Barun and Sonal have.
865 064dccaec462ecdc3adb582fb
64dccaec462ecdc3adb582fbThe table shows the total number of ice cream (Chocobar + Cornetto) was given by Santa Claus on the day of Xmas to 5 children. It also shows the number of Chocobar ice-creams is how much more or less percentage of the total number of Cornetto ice-creams.
- 11 ∶ 2false
- 22 ∶ 3false
- 33 ∶ 4false
- 44 ∶ 3true
- 5None of thesefalse
- Show AnswerHide Answer
- Workspace
- SingleChoice
Answer : 4. "4 ∶ 3"
Q:Directions: The following Pie Chart shows the export of different food grains from India in 2010. Study the chart and answer the questions:
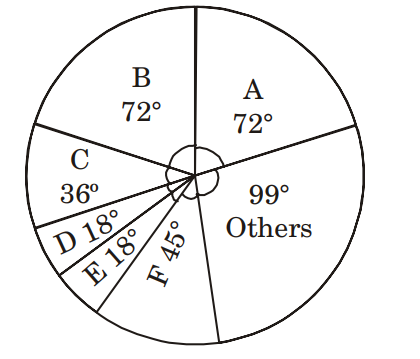
Of the total export of foodgrains, the percentage of crop B exported is
856 063be693d8f5b1f774c4c4c20
63be693d8f5b1f774c4c4c20- 115%false
- 220%true
- 318%false
- 410%false
- Show AnswerHide Answer
- Workspace
- SingleChoice