Data Interpretation Questions Practice Question and Answer
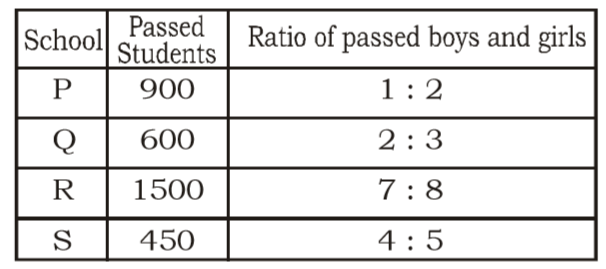
8 Q:Direction: Study the following table carefully and answer the given questions. Table shows the of passed students in four schools and ratio between passed boys and girls among them. The ratio between failed boys and girls is reverse of passed ratio between them.

The number passed of girls from School S is approximately what percentage of passed girls from School Q?
966 05e9d327f772f97276f50f67d
5e9d327f772f97276f50f67d
- 165 %false
- 272 %false
- 375 %false
- 469 %true
- 5None of thesefalse
- Show Answer
- Workspace
- SingleChoice
Answer : 4. "69 % "
Q:Direction: Study the following table carefully and answer the given questions. Table shows the of passed students in four schools and ratio between passed boys and girls among them. The ratio between failed boys and girls is reverse of passed ratio between them.

Find the ratio between the number of boys passed from School P and School Q.
972 05e9d320cdc1ff94610d200d1
5e9d320cdc1ff94610d200d1
- 14 : 5false
- 25 : 4true
- 36 : 5false
- 45 : 6false
- 51 : 2false
- Show Answer
- Workspace
- SingleChoice
Answer : 2. "5 : 4 "
Q:Direction: Study the following table carefully and answer the given questions. Table shows the of passed students in four schools and ratio between passed boys and girls among them. The ratio between failed boys and girls is reverse of passed ratio between them.

If in school P, 100 girls are failed in the exam, then find the total number of students in school P.
953 05e9d319c0a165a45b758541d
5e9d319c0a165a45b758541d
- 11,100false
- 21,300false
- 31,200true
- 41,400false
- 51,500false
- Show Answer
- Workspace
- SingleChoice
Answer : 3. "1,200"
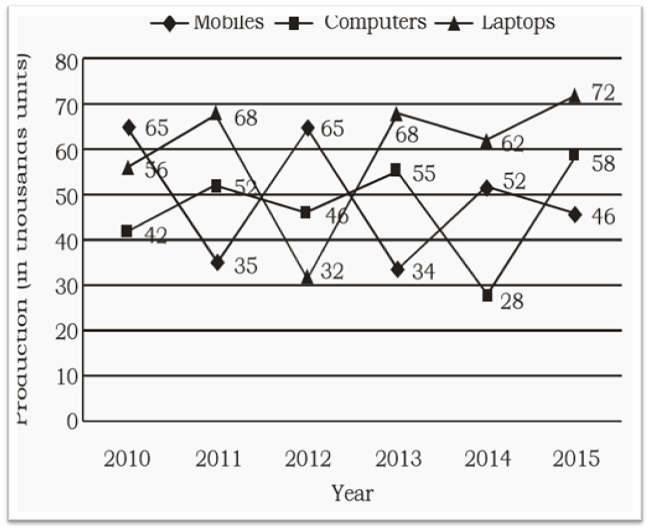
Q:Direction: Study the line graph carefully to answer the following questions.
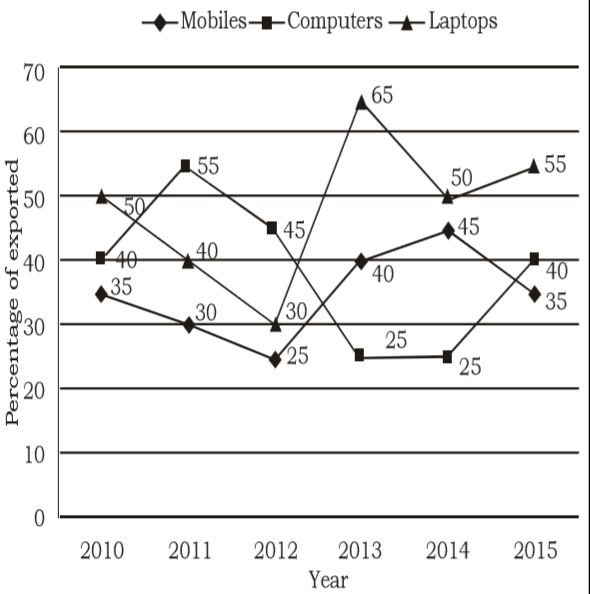
Line graph shows the production (in thousand units) and percentage of exported mobiles, computers and laptops.


In which of the following years was the production of Laptops exactly 40% of the total production of Mobiles, Computers and Laptops in that year?
1002 05e9d2213bf0a265d837b9c2c
5e9d2213bf0a265d837b9c2cLine graph shows the production (in thousand units) and percentage of exported mobiles, computers and laptops.


- 12011false
- 22012false
- 32015false
- 42014false
- 5None of thesetrue
- Show Answer
- Workspace
- SingleChoice
Answer : 5. "None of these "
Q:Direction: Study the line graph carefully to answer the following questions.
Line graph shows the production (in thousand units) and percentage of exported mobiles, computers and laptops.


If the ratio between export prices of Mobiles, Laptops and Computers are 2: 1: 1.5 in the year 2014, then what is the proportion of their export earnings?
848 05e9d1ea3bf0a265d837b90df
5e9d1ea3bf0a265d837b90dfLine graph shows the production (in thousand units) and percentage of exported mobiles, computers and laptops.


- 1454 : 232 : 213false
- 2476 : 210: 213false
- 3468 : 310: 105true
- 4cannot be determinedfalse
- 5None of thesefalse
- Show Answer
- Workspace
- SingleChoice
Answer : 3. "468 : 310: 105"
Q:Direction: Study the line graph carefully to answer the following questions.
Line graph shows the production (in thousand units) and percentage of exported mobiles, computers and laptops.


Find the ratio between Mobiles, Laptops and Computers exported in the year 2012.
945 05e9d1e23772f97276f50a277
5e9d1e23772f97276f50a277Line graph shows the production (in thousand units) and percentage of exported mobiles, computers and laptops.


- 1325 : 316: 419false
- 2325 : 192 : 414true
- 3319 : 216:425false
- 4256 : 355 : 135false
- 5None of thesefalse
- Show Answer
- Workspace
- SingleChoice
Answer : 2. "325 : 192 : 414"
Q:Direction: Study the line graph carefully to answer the following questions.
Line graph shows the production (in thousand units) and percentage of exported mobiles, computers and laptops.


Find the total number of Mobiles, Computers and Laptops exported in the year 2011.
912 05e9d1daedc1ff94610d1bfd6
5e9d1daedc1ff94610d1bfd6Line graph shows the production (in thousand units) and percentage of exported mobiles, computers and laptops.


- 164,350false
- 265,300false
- 366,300true
- 468,300false
- 5None of thesefalse
- Show Answer
- Workspace
- SingleChoice
Answer : 3. "66,300 "
Q:Direction: Study the line graph carefully to answer the following questions.
Line graph shows the production (in thousand units) and percentage of exported mobiles, computers and laptops.


Find the total number Mobiles exported in the year 2011, 2013 and 2015 together?
808 05e9d1c5e0a165a45b7580c29
5e9d1c5e0a165a45b7580c29Line graph shows the production (in thousand units) and percentage of exported mobiles, computers and laptops.


- 140,200true
- 242,010false
- 341,998false
- 440,960false
- 5None of thesefalse
- Show Answer
- Workspace
- SingleChoice

