Data Interpretation Questions Practice Question and Answer
8 Q:Directions : In an Institution there are 800 students. Students use different modes of transport for going to the institution and return. The given pie diagram represents the requisite data. Study the diagram carefully and answer the questions.

The number of students who do not use institute bus is
618 063ac3322e541fa7a013045e0
63ac3322e541fa7a013045e0- 1330false
- 2350false
- 3480false
- 4320true
- Show Answer
- Workspace
- SingleChoice
Answer : 4. "320 "
Q:The pie graph given here shows the break-up of the cost of construction of a house.
Assuming that the total cost of construction is ₹ 6,00,000, answer the questions.
Break-up of the cost of construction of a house
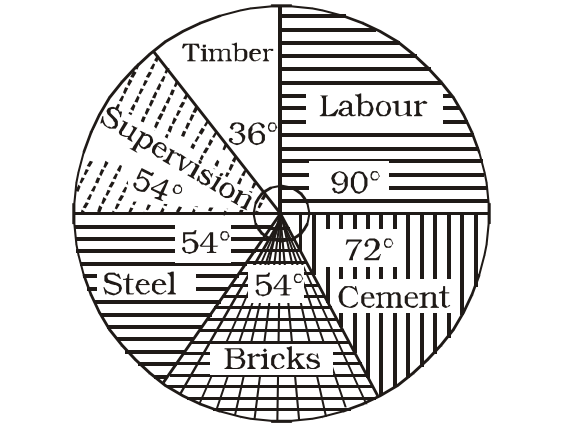
The amount spent on labour exceeds the amount spent on steel by
617 06331968a31300b7ce48a8eba
6331968a31300b7ce48a8eba- 15 per cent of the total cost.false
- 210 per cent of the total cost.true
- 312 per cent of the total cost.false
- 415 per cent of the total cost.false
- Show Answer
- Workspace
- SingleChoice
Answer : 2. "10 per cent of the total cost. "
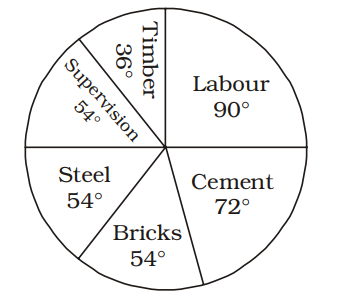
Q:The pie graph given here shows the break-up of the cost of construction of a house.
Assuming that the total cost of construction is ₹ 6,00,000, answer the questions.
Break-up of the cost of construction of a house
The amount spent on cement, steel and supervision is what percent of the total cost of construction?
604 06332dfac5c208a6bf707bc10
6332dfac5c208a6bf707bc10- 140%false
- 245%false
- 350%true
- 455%false
- Show Answer
- Workspace
- SingleChoice
Answer : 3. "50% "
Q:Directions: Following is the pie-chart showing the spending of a family on various items in a particular year
Study the pie chart and answer questions
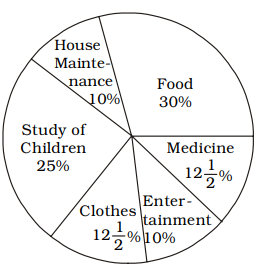
Angle of the pie chart representing the expenditure on entertainment is
604 063be702174eba5069d517362
63be702174eba5069d517362- 115°false
- 210°false
- 336°true
- 426°false
- Show Answer
- Workspace
- SingleChoice
Answer : 3. "36°"
Q:Directions : The pie graph indicates the break-up of the cost of construction of a house. Assuming that the total cost of construction is Rs 6,00,000, answer the following questions.
The amount spent on labor exceeds the amount spent on supervision by :
600 063aac38ae541fa7a0123208a
63aac38ae541fa7a0123208a
- 1₹ 1,00,000false
- 2₹ 1,20,000false
- 3₹ 60,000true
- 4₹ 30,000false
- Show Answer
- Workspace
- SingleChoice
Answer : 3. "₹ 60,000 "
Q: The following pie chart shows the number of bags sold by 7 different shops during a month as percentages of the total number of bags sold during this month by these 7 shops taken together.

If the total number of bags sold during the given month by these 7 shops taken together was 1400, then what was the total number of bags sold by S3 and S 7 taken together?
598 0642ac3aded76c064b863b95b
642ac3aded76c064b863b95b- 1240false
- 2196false
- 3224true
- 4210false
- Show Answer
- Workspace
- SingleChoice
Answer : 3. "224 "
Q:Directions: Read the given pie and table carefully and answer the following questions.
The pie chart shows the percentage distribution of people who found COVID – 19 positive in four major cities of India from 1st July to 31st August 2020 and the table shows the number of people who tested positive in July from these cities.
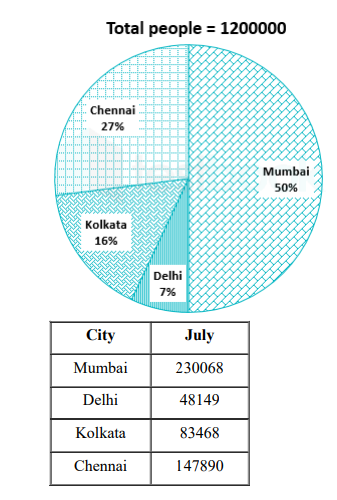
Total peoples tested positive in Delhi is what percent of the total number of people tested positive in Mumbai?
594 064f567912bbb242750e8a3fd
64f567912bbb242750e8a3fd- 111%false
- 214%true
- 316%false
- 418%false
- 519%false
- Show Answer
- Workspace
- SingleChoice
Answer : 2. "14%"
Q:Directions: The following Pie Chart shows the export of different food grains from India in 2010. Study the chart and answer the questions:
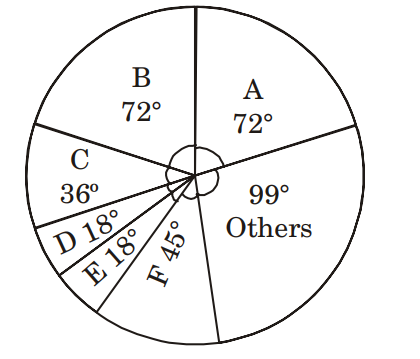
The three crops which combine to contribute to exactly 50% of the total export of food grains are
590 063be6aa71b93047bc20cd365
63be6aa71b93047bc20cd365- 1A, F and othersfalse
- 2B, C and Ffalse
- 3A, B and Ctrue
- 4C, F and othersfalse
- Show Answer
- Workspace
- SingleChoice