Data Interpretation Questions Practice Question and Answer
8 Q:Directions : A bar graph showing the heights of six mountain peaks is given below. Study the bar graph and answer the questions.

When the heights of the given peaks are written in ascending order, what is the average of the middle two peaks?
642 063930cfa9dda13791d7446ff
63930cfa9dda13791d7446ff- 17950 mfalse
- 27560 mfalse
- 37650 mfalse
- 47850 mtrue
- Show Answer
- Workspace
- SingleChoice
Answer : 4. "7850 m"
Q:Directions : The pie graph indicates the break-up of the cost of construction of a house. Assuming that the total cost of construction is Rs 6,00,000, answer the following questions.
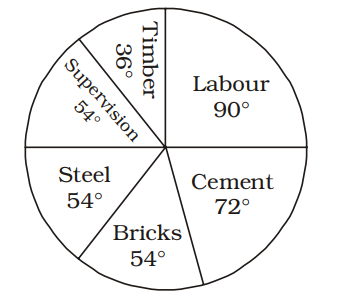
The percentage of the total cost of construction spent on cement, steel and supervision is :
641 063aac4d45770eb565d513939
63aac4d45770eb565d513939
- 150%true
- 255%false
- 360%false
- 465%false
- Show Answer
- Workspace
- SingleChoice
Answer : 1. "50%"
Q:Directions : Given here is a pie chart showing the cost of gold in 2010, 2011, 2012 and 2013. Study the chart and answer the following questions
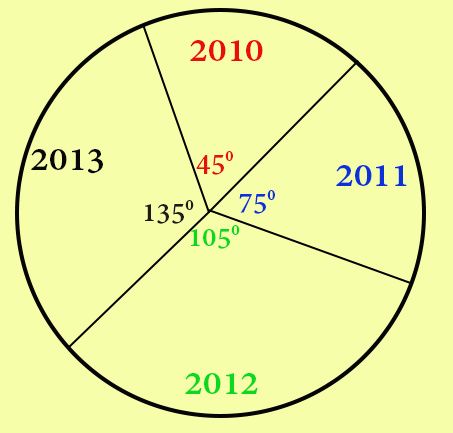
The ratio of the price of gold in the two years 2010 and 2013 is
638 064539d6f13eb5908ae3544d5
64539d6f13eb5908ae3544d5- 11 : 2false
- 21 : 3true
- 31 : 4false
- 41 : 5false
- Show Answer
- Workspace
- SingleChoice
Answer : 2. "1 : 3"
Q:Directions: Read the given pie and table carefully and answer the following questions.
The pie chart shows the percentage distribution of people who found COVID – 19 positive in four major cities of India from 1st July to 31st August 2020 and the table shows the number of people who tested positive in July from these cities.
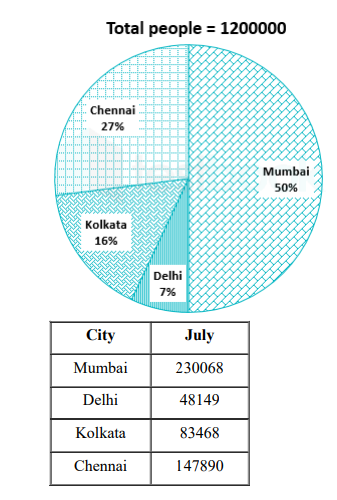
What is the average of the number of people in August from Mumbai and the number of people in July from Chennai who tested positive?
637 064f566a7a1e68c7201ab110d
64f566a7a1e68c7201ab110d- 1258911true
- 2324526false
- 3242478false
- 4278562false
- 5None of thesefalse
- Show Answer
- Workspace
- SingleChoice
Answer : 1. "258911"
Q:Direction: Read the following graph carefully and answer the following questions:
The following bar graph shows the quantity(in kg) of wheat, rice, pulses and salts sold by two companies P and Q in the month of January.
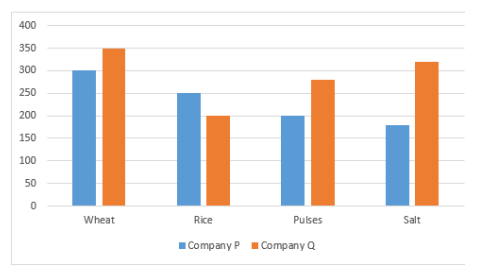
What is the ratio of the total quantity (in kg) of wheat and pulses sold by company P to company Q?
630 064ddf36690a003851d0552c3
64ddf36690a003851d0552c3The following bar graph shows the quantity(in kg) of wheat, rice, pulses and salts sold by two companies P and Q in the month of January.
- 14:9false
- 24:5true
- 34:3false
- 45:4false
- 54:7false
- Show Answer
- Workspace
- SingleChoice
Answer : 2. "4:5"
Q:Directions: Read the given pie and table carefully and answer the following questions.
The pie chart shows the percentage distribution of people who found COVID – 19 positive in four major cities of India from 1st July to 31st August 2020 and the table shows the number of people who tested positive in July from these cities.
Total numbers of cases in July are how much more or less than the total number of cases in August of all four cities?
624 064f5673a2bbb242750e8a25c
64f5673a2bbb242750e8a25c- 1509575false
- 2690425false
- 3180850true
- 4245689false
- 5None of thesefalse
- Show Answer
- Workspace
- SingleChoice
Answer : 3. "180850"
Q:Directions: The table given here shows the production of five types of cars by a company in the year 1989 to 1994. Study the table and answer questions.
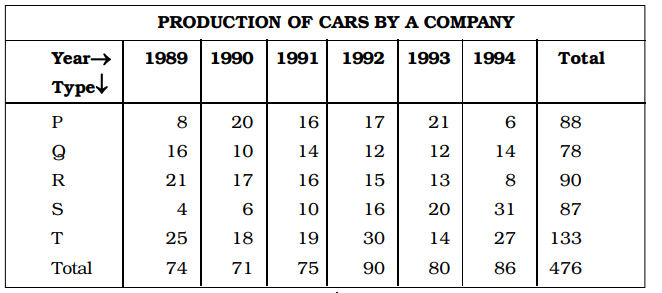
In which year the total production of cars of types P and Q together was equal to the total production of cars of types R and S together?
623 0632db25031300b7ce47a86f9
632db25031300b7ce47a86f9- 11990false
- 21991false
- 31994false
- 4None of the abovetrue
- Show Answer
- Workspace
- SingleChoice
Answer : 4. "None of the above"
Q: Given is a line graph showing the number of accidents in a city during the first 6 months of 1999.

The decrease % of accidents from May to June is
623 063ee1dc6b0030e718d806138
63ee1dc6b0030e718d806138- 1false
- 2false
- 3true
- 4false
- Show Answer
- Workspace
- SingleChoice