Data Interpretation Questions Practice Question and Answer
8 Q:Directions: The bar graph given below shows the production (in ' 000 tones) of rice of a country for the year 2007 to 2011. Study the graph carefully and answer the question given below it.
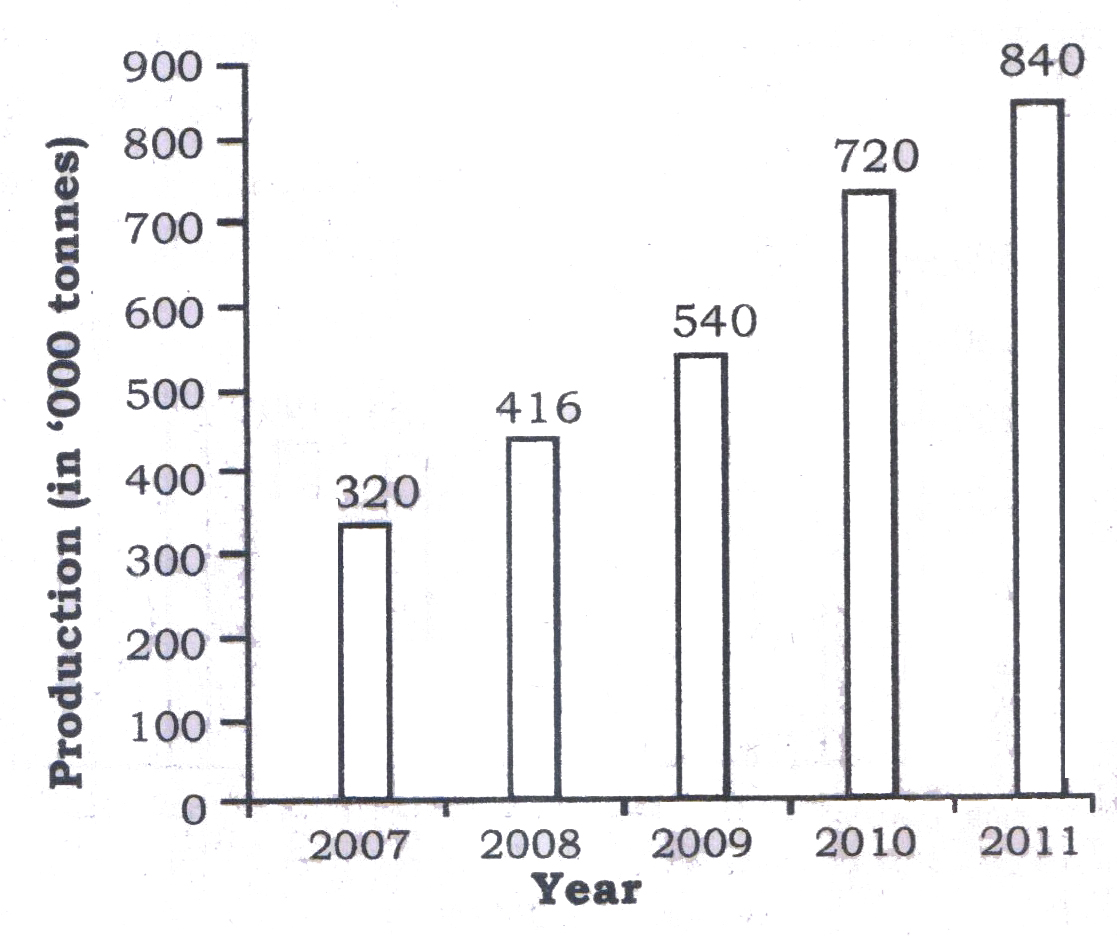
What is the percentage increase in the production of rice in the year 2008 in comparison to the year 2007?
933 05e8185db4e941d3661dcba05
5e8185db4e941d3661dcba05- 125false
- 230true
- 335false
- 440false
- Show Answer
- Workspace
- SingleChoice
Answer : 2. "30 "
Q:Directions: The bar graph given below shows the production (in ' 000 tones) of rice of a country for the year 2007 to 2011. Study the graph carefully and answer the question given below it.
What is the average production of rice per year from 2009 to 2011? (in thousand tones)
843 05e81867ad56d695255db5622
5e81867ad56d695255db5622- 1700true
- 2550false
- 3860false
- 4900false
- Show Answer
- Workspace
- SingleChoice
Answer : 1. "700 "
Q:Directions: The bar graph given below shows the production (in ' 000 tones) of rice of a country for the year 2007 to 2011. Study the graph carefully and answer the question given below it.
The production of rice in the year 2010 is how much percent more than the production of rice in the year 2009?
903 05e8186dcd56d695255db5657
5e8186dcd56d695255db5657- 121.5false
- 237.5false
- 342.5false
- 433.33true
- Show Answer
- Workspace
- SingleChoice
Answer : 4. "33.33 "
Q:Directions: The bar graph given below shows the production (in ' 000 tones) of rice of a country for the year 2007 to 2011. Study the graph carefully and answer the question given below it.
The production of rice in the year 2011 is what percent of the production of rice in 2010?
975 05e81873d4e941d3661dcbfc5
5e81873d4e941d3661dcbfc5- 1116.66true
- 2121.5false
- 3133.33false
- 4108.5false
- Show Answer
- Workspace
- SingleChoice
Answer : 1. "116.66 "
Q:Study the following graph to answer these questions :
Percent profit earned by two companies A & B over the years.
Profit = Income – Expenditure
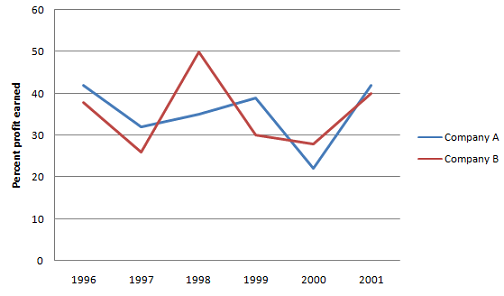
Total expenditure of Company A & B together in 2001 was Rs. 13.5 lakhs. What was the total income of the two companies (in Rs. lakh) in that year?
1918 05e79ada04572817353d62b49
5e79ada04572817353d62b49Percent profit earned by two companies A & B over the years.
Profit = Income – Expenditure
- 119.575false
- 220.25false
- 319.75false
- 4Cannot be determinedtrue
- 5None of thesefalse
- Show Answer
- Workspace
- SingleChoice
Answer : 4. "Cannot be determined"
Q:Study the following graph to answer these questions :
Percent profit earned by two companies A & B over the years.
Profit = Income – Expenditure
Expenditure of Company B in years 1996 and 1997 were in the ratio of 5:7 respectively. What was the respective ratio of their incomes?
2358 05e79abcb8560ba13b027618f
5e79abcb8560ba13b027618fPercent profit earned by two companies A & B over the years.
Profit = Income – Expenditure
- 110:13false
- 28:13false
- 313:14false
- 411:14false
- 5None of thesetrue
- Show Answer
- Workspace
- SingleChoice
Answer : 5. "None of these"
Q:Study the following graph to answer these questions :
Percent profit earned by two companies A & B over the years.
Profit = Income – Expenditure
If the expenditure of Company A in 1997 was Rs.70 lakhs and income of Company A in 1997 was equal to its expenditure in 1998, what was the total income (in Rs. lakh) of the Company A in 1997 & 1998 together?
2341 05e79ab3f8560ba13b0276082
5e79ab3f8560ba13b0276082Percent profit earned by two companies A & B over the years.
Profit = Income – Expenditure
- 1175false
- 2131.25false
- 3218.75true
- 4Cannot be determinedfalse
- 5None of thesefalse
- Show Answer
- Workspace
- SingleChoice
Answer : 3. "218.75"
Q:Study the following graph to answer these questions :
Percent profit earned by two companies A & B over the years.
Profit = Income – Expenditure
Expenditure of Company B in 1999 was 90% of its expenditure in 1998. Income of Company B in 1999 was what percent of its income in 1998?
2983 05e79aaa54572817353d62577
5e79aaa54572817353d62577Percent profit earned by two companies A & B over the years.
Profit = Income – Expenditure
- 1130.5false
- 2false
- 3121.5false
- 4true
- 5None of thesefalse
- Show Answer
- Workspace
- SingleChoice