Data Interpretation Questions Practice Question and Answer
8 Q:Directions: Study the following information carefully and answer the questions given below.
In the table, the percentage of shirts (formal and casual) sold out of the total number of shirts sold in the week and the number of casual shirts sold data related to the number of shirts sold on ve weekdays – Monday, Tuesday, Wednesday, Thursday and Friday are given.
Total number of shirts sold in the week = x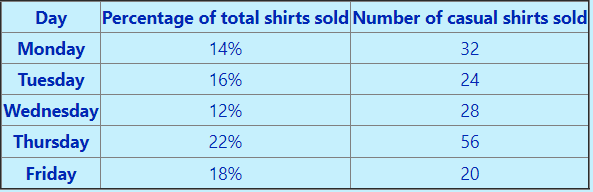 Note: Total number of shirts sold on Saturday and Sunday together = 72
The number of casual shirts sold on Thursday is what per cent more than the number of formal shirts sold on Tuesday?
548 064e5ef6460749cb6f2e5fffd
64e5ef6460749cb6f2e5fffdIn the table, the percentage of shirts (formal and casual) sold out of the total number of shirts sold in the week and the number of casual shirts sold data related to the number of shirts sold on ve weekdays – Monday, Tuesday, Wednesday, Thursday and Friday are given.
Note: Total number of shirts sold on Saturday and Sunday together = 72- 120%false
- 250%false
- 340%true
- 437.5%false
- 5None of thesefalse
- Show Answer
- Workspace
- SingleChoice
Answer : 3. "40%"
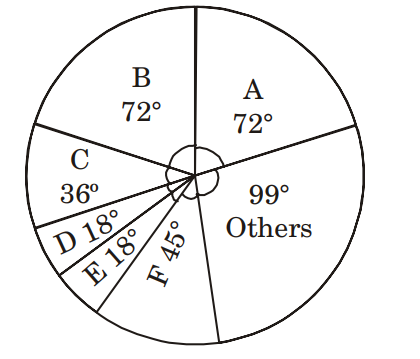
Q:Directions : In an Institution there are 800 students. Students use different modes of transport for going to the institution and return. The given pie diagram represents the requisite data. Study the diagram carefully and answer the questions.

The number of students who go to institute on foot is
547 063ac336e612ead74ab54dc90
63ac336e612ead74ab54dc90- 1160true
- 2170false
- 3120false
- 4106false
- Show Answer
- Workspace
- SingleChoice
Answer : 1. "160 "
Q: The table below gives the ranks secured by five different students in three different subjects in a qualifying examination:
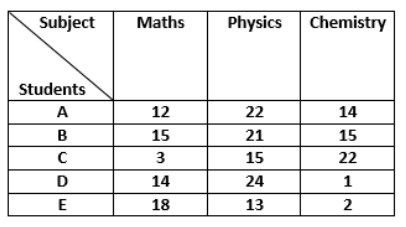
Find the positive difference between the ranks secured by A in Physics and in Maths.
546 06426e16c32185cce37134f5f
6426e16c32185cce37134f5f- 125false
- 210true
- 315false
- 420false
- Show Answer
- Workspace
- SingleChoice
Answer : 2. "10"
Q:Directions : Study the following bar graph and answer the questions.
company (in lakhs of rupees) for the years 1994-1997:
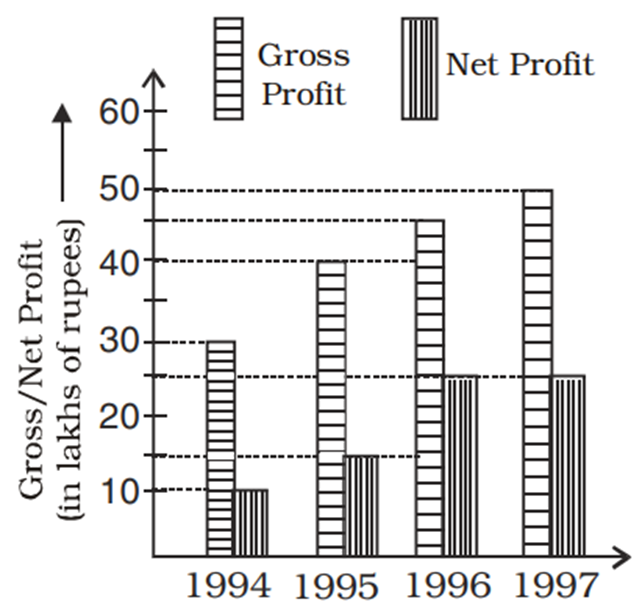
For the entire four years as shown, the ratio of total gross profit to total net profit is
546 06460f6a2cdae930acb7460a3
6460f6a2cdae930acb7460a3- 113 : 4false
- 211 : 6false
- 311 : 5true
- 49 : 4false
- Show Answer
- Workspace
- SingleChoice
Answer : 3. "11 : 5 "
Q:Directions: Study the Bar diagram carefully and answer the questions.
The Bar diagram shows the trends of foreign direct investment (FDI) into India from all over the World (in Rs. crores).
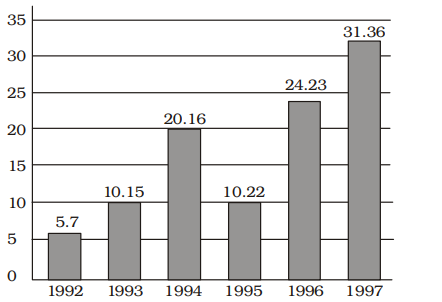
The absolute difference in FDI to India between 1996 and 1997 is
544 063a56b4a8fc9692134068f38
63a56b4a8fc9692134068f38 - 1Rs. 7.29 croresfalse
- 2Rs. 7.13 crorestrue
- 3Rs. 7.16 croresfalse
- 4Rs. 7.22 croresfalse
- Show Answer
- Workspace
- SingleChoice
Answer : 2. "Rs. 7.13 crores "
Q:Directions: The table given here shows the production of five types of cars by a company in the year 1989 to 1994. Study the table and answer questions.
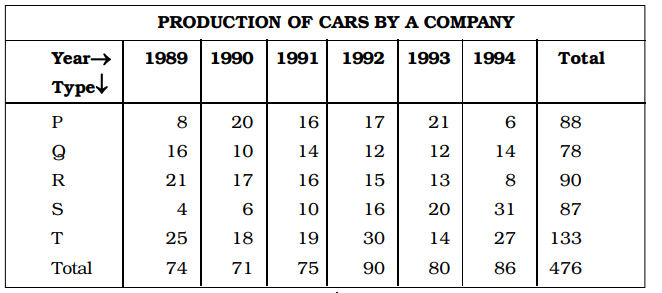
During the period 1989-94, in which type of cars was a continuous increase in production?
540 0632db292751e5310a5d0fb16
632db292751e5310a5d0fb16- 1Pfalse
- 2Qfalse
- 3Rfalse
- 4Strue
- Show Answer
- Workspace
- SingleChoice
Answer : 4. "S"
Q:Directions : The following graph shows production (in thousands) of two types (P and Q) of vehicles by a factory over the years 2009 to 2014. Study the graph and answer the given questions.
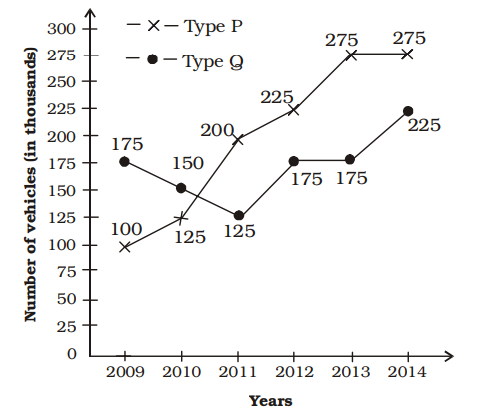
The production of Type Q vehicles in 2010 was approximately what percent of Type P vehicles in 2014?
540 063a56e408fc9692134069535
63a56e408fc9692134069535 - 160false
- 245.5false
- 354.5true
- 475false
- Show Answer
- Workspace
- SingleChoice
Answer : 3. "54.5 "
Q:Directions: The following Pie Chart shows the export of different food grains from India in 2010. Study the chart and answer the questions:
If the revenue from 1 quintal of crop A is thrice that from 1 quintal of crop C, then the ratio of the total revenues of A and C is
539 063be6b9f1b93047bc20cdf06
63be6b9f1b93047bc20cdf06- 11 : 6false
- 22 : 3false
- 33 : 2false
- 46 : 1true
- Show Answer
- Workspace
- SingleChoice