Data Interpretation Questions Practice Question and Answer
8 Q:Directions: The table given here shows the production of five types of cars by a company in the year 1989 to 1994. Study the table and answer questions.
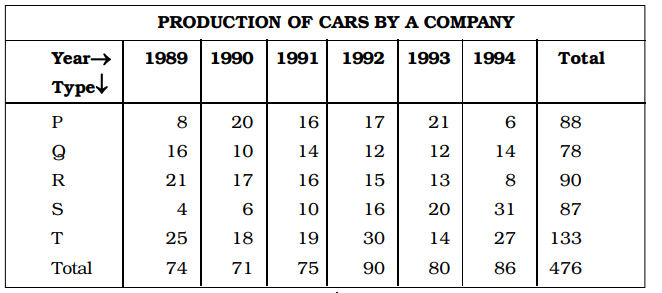
The production of which type of car was 25% of the total production of all types of cars during 1993?
538 0632db32a751e5310a5d0fc30
632db32a751e5310a5d0fc30- 1Strue
- 2Rfalse
- 3Qfalse
- 4Pfalse
- Show Answer
- Workspace
- SingleChoice
Answer : 1. "S "
Q:Directions: A survery of film watching habits of people living in five cities P, Q, R, S and T is summarised below in a table. The coulmn I in the table gives percentage of film-watchers in each city who see only one film a week. The column II gives the total number of film-watchers who see two or more films per week.
Read the table and answer the following questions.
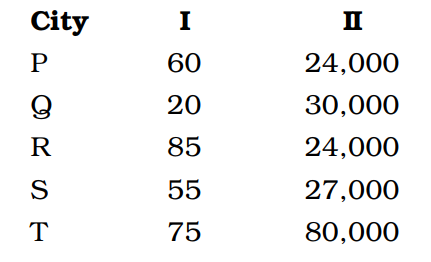
Which city has the highest number of film watchers who see only one film in a week?
537 0632db57a1656651c9eaaf48c
632db57a1656651c9eaaf48c- 1Pfalse
- 2Rfalse
- 3Sfalse
- 4Ttrue
- Show Answer
- Workspace
- SingleChoice
Answer : 4. "T "
Q:Direction: Study the given pie chart carefully and answer the following questions accordingly. Given pie chart shows the percentage of players taking part in six different games in an event.
Total number of Players = 1800
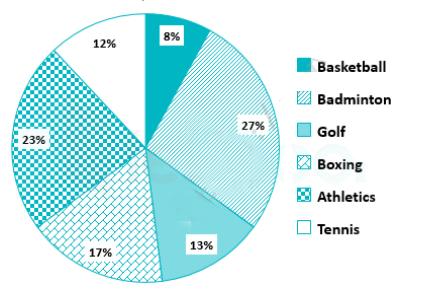
What is the total number of players taking part in Athletics, Badminton and Tennis?
537 064e75f654a145f0934d9db6f
64e75f654a145f0934d9db6f- 11226false
- 21116true
- 31176false
- 4998false
- 5None of thesefalse
- Show Answer
- Workspace
- SingleChoice
Answer : 2. "1116"
Q:Directions : Study the following frequency polygon and answer the questions. Given a line graph showing the number of students passed in Higher Secondary Examination in a school over the years 2008 to 2013.

The average of passed students in the years 2008, 2009, 2012 approximately is
534 0639321109dda13791d752daf
639321109dda13791d752daf- 1134.32false
- 2134.41false
- 3134.56false
- 4134.67true
- Show Answer
- Workspace
- SingleChoice
Answer : 4. "134.67"
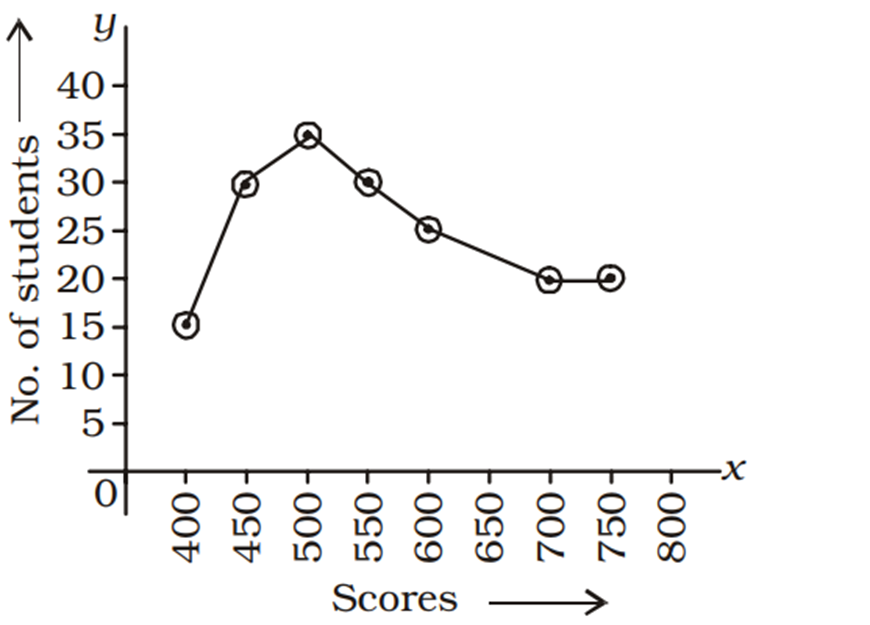
Q: The adjoining diagram is frequency polygon for the scores of students in a test.
What is the total number of students appeared in the test?
534 063ee1c6a7312b71d33e2f206
63ee1c6a7312b71d33e2f206What is the total number of students appeared in the test?
- 1180true
- 2200false
- 3250false
- 4150false
- Show Answer
- Workspace
- SingleChoice
Answer : 1. "180 "
Q: The following table shows the numbers of chairs made of plastic and of steel in 5 different colours that were sold from a furniture showroom during a sale.
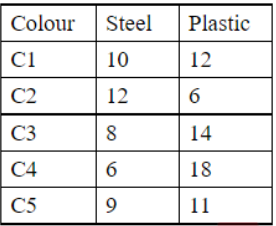
The total number of chairs of colour C3 sold are what percentage of all the chairs of these 5 colours sold, both plastic and steel ones put together? [Give your answer correct to 2 decimal places.]
534 06433ce607ac9a186e4f72182
6433ce607ac9a186e4f72182- 117.75%false
- 220.75%true
- 314.75%false
- 423.75%false
- Show Answer
- Workspace
- SingleChoice
Answer : 2. "20.75%"
Q:Directions : In an Institution there are 800 students. Students use different modes of transport for going to the institution and return. The given pie diagram represents the requisite data. Study the diagram carefully and answer the questions.

The number of students who travel in public bus is
531 063ac32e2fb04114b2d3cea1a
63ac32e2fb04114b2d3cea1a- 1150false
- 2120true
- 3130false
- 4125false
- Show Answer
- Workspace
- SingleChoice
Answer : 2. "120"
Q:Directions : The expenses of a country for a particular year is given in Pie–Chart. Read the Pie– Chart and answer the questions.
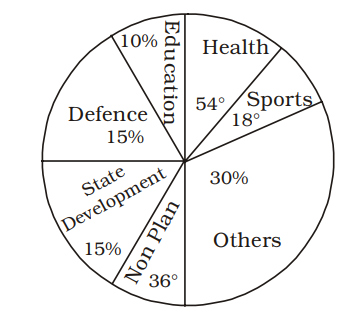
If the total amount spent by the Government during the year was ₹ 1,00,000 crores, then the amount spent on Health and Education together was
524 063ac3433612ead74ab54df8b
63ac3433612ead74ab54df8b- 1₹ 25,000 croretrue
- 2₹ 20,000 crorefalse
- 3₹ 30,000 crorefalse
- 4₹ 15,000 crorefalse
- Show Answer
- Workspace
- SingleChoice