Data Interpretation Questions Practice Question and Answer
8 Q:Directions: Study the Bar diagram carefully and answer the questions.
The Bar diagram shows the trends of foreign direct investment (FDI) into India from all over the World (in Rs. crores).
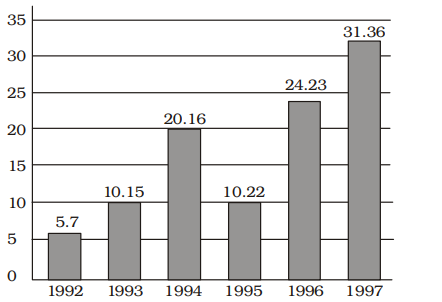
The sum of FDI of 1992 and 1993 is
521 063a569f024e8fb08b9fe1729
63a569f024e8fb08b9fe1729 - 1Rs. 15.58 croresfalse
- 2Rs. 15.85 crorestrue
- 3Rs. 15.22 croresfalse
- 4Rs. 15.65 croresfalse
- Show Answer
- Workspace
- SingleChoice
Answer : 2. "Rs. 15.85 crores "
Q:Directions : In an Institution there are 800 students. Students use different modes of transport for going to the institution and return. The given pie diagram represents the requisite data. Study the diagram carefully and answer the questions.

If the total amount spent by the Government during the year was ₹ 3,00,000 crores, the amount spent on state development exceeds that on sports by
516 063ac34874edf0d569930f73f
63ac34874edf0d569930f73f- 1₹ 30,000 croretrue
- 2₹ 45,000 crorefalse
- 3₹ 35,000 crorefalse
- 4₹ 25,000 crorefalse
- Show Answer
- Workspace
- SingleChoice
Answer : 1. "₹ 30,000 crore "
Q:Direction: Read the following table carefully and answer the following questions:
Table shows the percentage of male and female employees in different education in a company and total number of males and females:
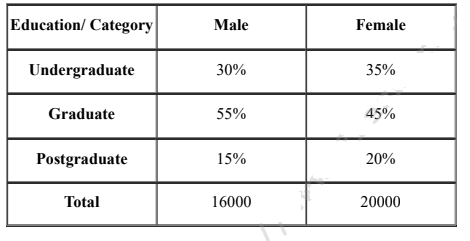
Find the postgraduate employees of a company are approximately what percent of total employees of a company?
516 064e7516813f72deddceb0e95
64e7516813f72deddceb0e95- 112%false
- 222%false
- 315%false
- 426%false
- 518%true
- Show Answer
- Workspace
- SingleChoice
Answer : 5. "18%"
Q:Directions : Read the graph and answer the following questions.
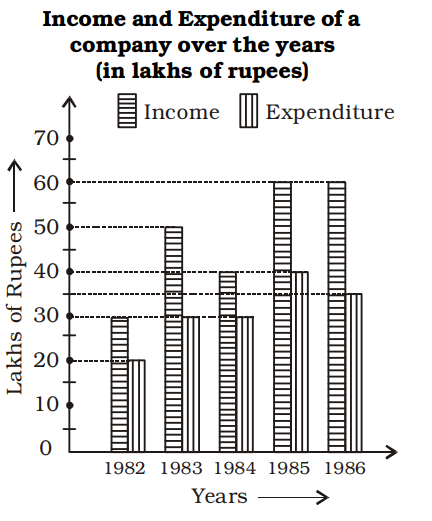
What is the difference in profit between 1983 and 1984 (in lakhs of rupees) ?
512 06461024745f1450a80c4103d
6461024745f1450a80c4103d- 1No profitfalse
- 25false
- 310true
- 415false
- Show Answer
- Workspace
- SingleChoice
Answer : 3. "10 "
Q:Directions: Read the below data carefully and answer the following questions.
The table shows the total number of ice cream (Chocobar + Cornetto) was given by Santa Claus on the day of Xmas to 5 children. It also shows the number of Chocobar ice-creams is how much more or less percentage of the total number of Cornetto ice-creams.
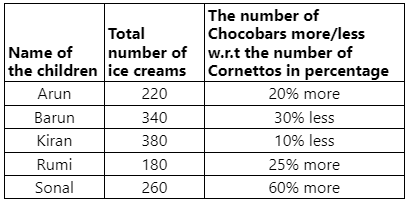
What is the difference between the entire number of Cornettos Arun and Kiran have and therefore the total number of Chocobars Barun and Rumi have?
510 064dcca184e4237f6c98acb94
64dcca184e4237f6c98acb94The table shows the total number of ice cream (Chocobar + Cornetto) was given by Santa Claus on the day of Xmas to 5 children. It also shows the number of Chocobar ice-creams is how much more or less percentage of the total number of Cornetto ice-creams.
- 120false
- 260true
- 330false
- 440false
- 550false
- Show Answer
- Workspace
- SingleChoice
Answer : 2. "60"
Q:Directions : The following graph shows production (in thousands) of two types (P and Q) of vehicles by a factory over the years 2009 to 2014. Study the graph and answer the given questions.
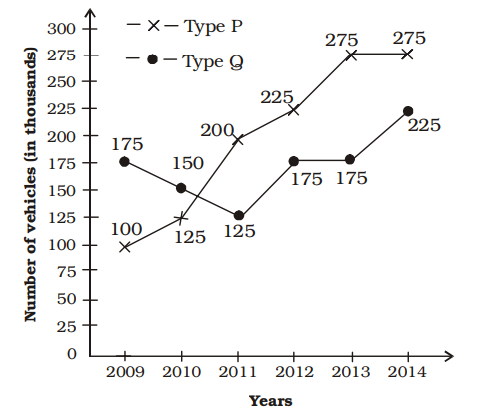
The ratio of total production of Type P vehicles to total production of type Q vehicles over the years is
509 063a56da8b580da5a6237fd52
63a56da8b580da5a6237fd52 - 148 : 41true
- 25 : 8false
- 35 : 8false
- 441 : 48false
- Show Answer
- Workspace
- SingleChoice
Answer : 1. "48 : 41 "
Q:Directions: The table given here shows the production of five types of cars by a company in the year 1989 to 1994. Study the table and answer questions.
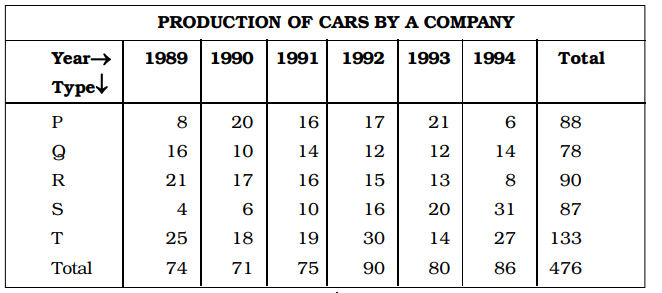
The percent increased in total production of all types of cars in1992 to that in 1991 was :
504 0632db3615c208a6bf7f2677e
632db3615c208a6bf7f2677e- 115%false
- 220%true
- 325%false
- 430%false
- Show Answer
- Workspace
- SingleChoice
Answer : 2. "20%"
Q:Directions : A bar graph showing the heights of six mountain peaks is given below. Study the bar graph and answer the questions.

Which peak is the second highest ?
502 063930c38d319b37ca19af109
63930c38d319b37ca19af109- 1Bfalse
- 2Ctrue
- 3Afalse
- 4Efalse
- Show Answer
- Workspace
- SingleChoice