Data Interpretation Questions Practice Question and Answer
8 Q:Directions : A bar graph showing the heights of six mountain peaks is given below. Study the bar graph and answer the questions.

Which peak is the second highest ?
510 063930c38d319b37ca19af109
63930c38d319b37ca19af109- 1Bfalse
- 2Ctrue
- 3Afalse
- 4Efalse
- Show Answer
- Workspace
- SingleChoice
Answer : 2. "C "
Q:Direction: Study the given pie chart carefully and answer the following questions accordingly. Given pie chart shows the percentage of players taking part in six different games in an event.
Total number of Players = 1800
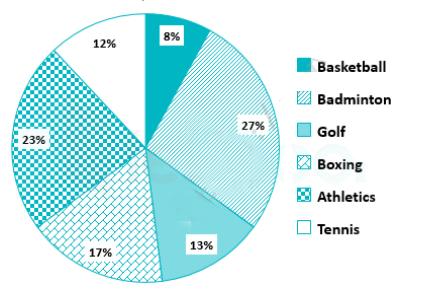
If two - ninth of the players taking part in Boxing is female, then the number of male Boxing players is approximately what percentage of the total number of players taking part in Athletics?
509 064e75fdb4a145f0934d9dc32
64e75fdb4a145f0934d9dc32- 157%true
- 242%false
- 363%false
- 469%false
- 569%false
- Show Answer
- Workspace
- SingleChoice
Answer : 1. "57%"
Q:Directions: Study the following information carefully and answer the questions given below.
In the table, the percentage of shirts (formal and casual) sold out of the total number of shirts sold in the week and the number of casual shirts sold data related to the number of shirts sold on ve weekdays – Monday, Tuesday, Wednesday, Thursday and Friday are given.
Total number of shirts sold in the week = x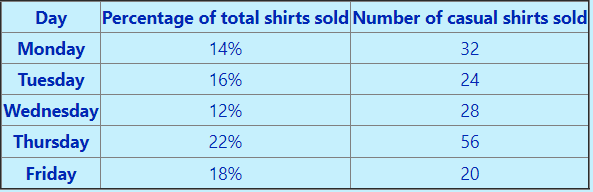 Note: Total number of shirts sold on Saturday and Sunday together = 72
What is the average number of total shirts sold on Wednesday, Friday, Saturday and Sunday together?
508 064e5ed45de1aa1b70fd9c28f
64e5ed45de1aa1b70fd9c28fIn the table, the percentage of shirts (formal and casual) sold out of the total number of shirts sold in the week and the number of casual shirts sold data related to the number of shirts sold on ve weekdays – Monday, Tuesday, Wednesday, Thursday and Friday are given.
Note: Total number of shirts sold on Saturday and Sunday together = 72- 164false
- 224false
- 336false
- 448true
- 5None of thesefalse
- Show Answer
- Workspace
- SingleChoice
Answer : 4. "48"
Q:Directions: Following is the pie-chart showing the spending of a family on various items in a particular year
Study the pie chart and answer questions
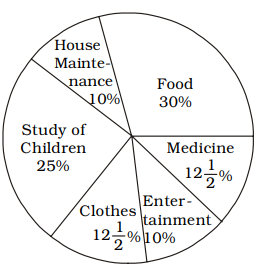
The ratio of the total amount spent for food and medicine is
507 063be6ef28f5b1f774c4c911f
63be6ef28f5b1f774c4c911f- 11 : 2false
- 23 : 1false
- 312 : 5true
- 411 : 5false
- Show Answer
- Workspace
- SingleChoice
Answer : 3. "12 : 5 "
Q:Directions: Read the pie chart carefully and answer the following questions.
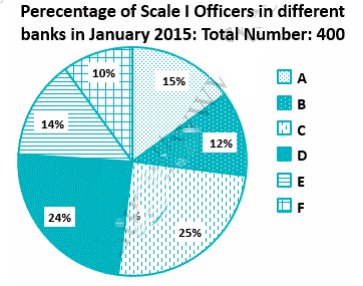
Note: No new employees joined the given banks of left the given banks from January 2015 to December 2015.
In January 2016, some Scale I Officers resigned from Bank C and all of them joined Bank B. If the resultant respective ratio between the number of Scale I Officers in Bank C and that in Bank B is 24 : 13, what is the number of Scale I Officers who resigned from Bank C?
507 064f1e0103be218b6cde4ef0a
64f1e0103be218b6cde4ef0a- 13false
- 26false
- 37false
- 44true
- 55false
- Show Answer
- Workspace
- SingleChoice
Answer : 4. "4"
Q:Directions: The table given here shows the production of five types of cars by a company in the year 1989 to 1994. Study the table and answer questions.
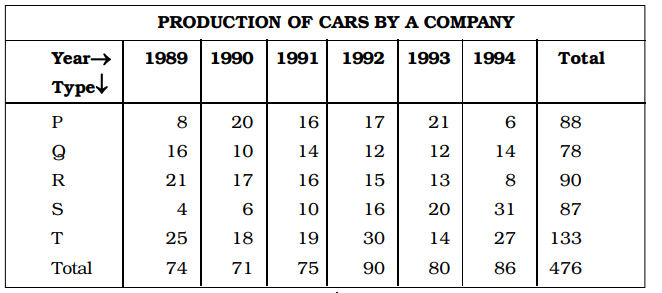
The percent increased in total production of all types of cars in1992 to that in 1991 was :
505 0632db3615c208a6bf7f2677e
632db3615c208a6bf7f2677e- 115%false
- 220%true
- 325%false
- 430%false
- Show Answer
- Workspace
- SingleChoice
Answer : 2. "20%"
Q:Directions: Following is the pie-chart showing the spending of a family on various items in a particular year
Study the pie chart and answer questions
If the total amount spent on the family during the year was ₹ 35,000, the amount spent for study of children and food together was
504 063be6fa261d62119f1dbc4a2
63be6fa261d62119f1dbc4a2- 119,250true
- 219,500false
- 319,750false
- 419,850false
- Show Answer
- Workspace
- SingleChoice
Answer : 1. "19,250 "
Q:Directions: The sub divided bar diagram given below depicts Higher secondary Students of a school for three years. Study the diagram and answer the questions

The percentage of the students passed with 2nd division in the year 2010 was
502 0645ce8abe67f3b0a568e543a
645ce8abe67f3b0a568e543a- 130%true
- 240%false
- 350%false
- 460%false
- Show Answer
- Workspace
- SingleChoice