Data Interpretation Questions Practice Question and Answer
8 Q:The circle-graph given here shows the spending of a country on various sports during a particular year. Study the graph carefully and answer the question given below it.
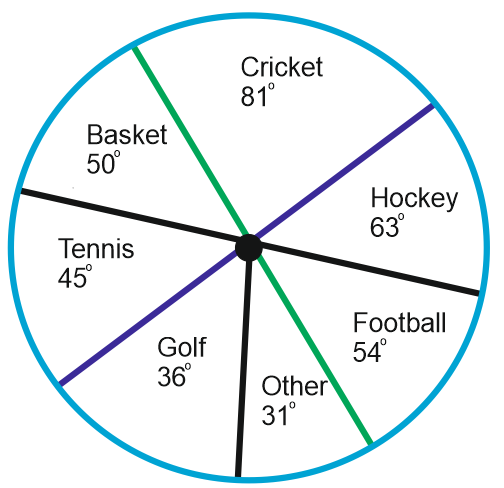
If the total amount spent on sports during the year be Rs. 1,80,00,000 the amount spent on Basketball exceeds that on Tennis by:
1559 05d70b20260d0a53645a46a8f
5d70b20260d0a53645a46a8f
- 1Rs. 2,50,000true
- 2Rs. 3,60,000false
- 3Rs. 3,75,000false
- 4Rs. 4,10,000false
- Show Answer
- Workspace
- SingleChoice
Answer : 1. "Rs. 2,50,000"
Q:The circle-graph given here shows the spending of a country on various sports during a particular year. Study the graph carefully and answer the question given below it.
If the total amount spent on sports during the year was Rs. 2 crores, the amount spent on cricket and Hockey together was:
1362 05d70afe4eb96471d6f364689
5d70afe4eb96471d6f364689
- 1Rs. 8,00,000false
- 2Rs. 80,00,000true
- 3Rs. 1,20,00,000false
- 4Rs. 1,60,00,000false
- Show Answer
- Workspace
- SingleChoice
Answer : 2. "Rs. 80,00,000"
Q:The circle-graph given here shows the spending of a country on various sports during a particular year. Study the graph carefully and answer the question given below it.
How much percent is more spent on Hockey than that on Golf?
1304 05d70aacf9004b376a58bd1b3
5d70aacf9004b376a58bd1b3
- 127 %false
- 235 %false
- 337.5 %false
- 475 %true
- Show Answer
- Workspace
- SingleChoice
Answer : 4. "75 %"
Q:The circle-graph given here shows the spending of a country on various sports during a particular year. Study the graph carefully and answer the question given below it.
What percent of the total spending is spent on Tennis?
1145 05d70a97ed8eebc768d1123cd
5d70a97ed8eebc768d1123cd
- 1true
- 2false
- 325 %false
- 445 %false
- Show Answer
- Workspace
- SingleChoice
Answer : 1. "
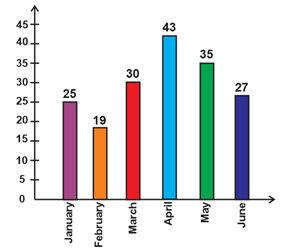
Q: Compared to the month of January, what is the percentage of decrease in accidents in the month of February?
1524 05d775f45a1321a5b0b595150
5d775f45a1321a5b0b595150- 125false
- 224true
- 330false
- 427false
- Show Answer
- Workspace
- SingleChoice
Answer : 2. "24"
Q:Directions-Study the following diagram and answer the four questions.
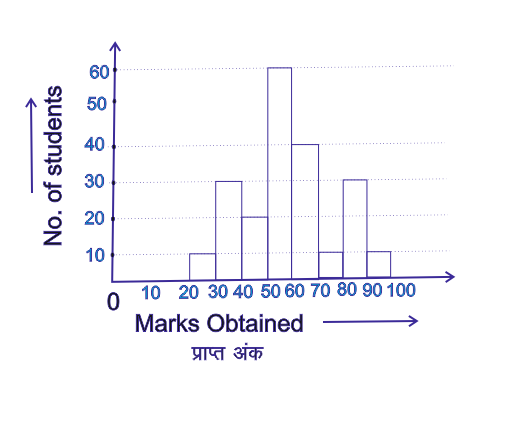
The percentage of students securing marks less than 50 is
1324 05daea745622dcb0d26318ea7
5daea745622dcb0d26318ea7- 1true
- 2false
- 3false
- 4false
- Show Answer
- Workspace
- SingleChoice
Answer : 1. "
Q:Directions-Study the following diagram and answer the four questions.
The total no. of students on whom this survey was made is
1106 05daea79bcca75847f4d932e8
5daea79bcca75847f4d932e8- 1190false
- 2200false
- 3220false
- 4210true
- Show Answer
- Workspace
- SingleChoice
Answer : 4. "210"
Q:Directions-Study the following diagram and answer the four questions.
The range of marks obtained by maximum no. of students is
1145 05daea692cca75847f4d92d20
5daea692cca75847f4d92d20- 130-40false
- 260-70false
- 350-60true
- 480-90false
- Show Answer
- Workspace
- SingleChoice