Logical Venn Diagrams Questions Practice Question and Answer
8 Q: In a class of 54 students, 24 drink milk, 28 drink tea and 8 drink none. Find how many drink both milk and tea?
2741 05eb50ca7a201e2350c47f57b
5eb50ca7a201e2350c47f57b- 18false
- 26true
- 32false
- 410false
- Show Answer
- Workspace
- SingleChoice
Answer : 2. "6 "
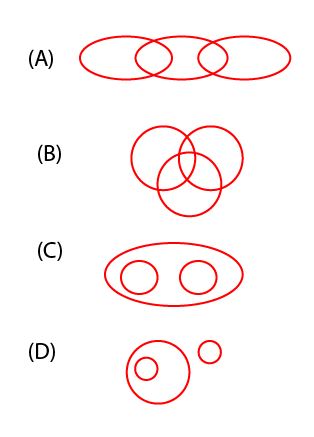
Q: Which of the following diagram indicates the best relation between Spinach, Brinjal, and Vegetables?
2691 05e8b24e967af633f22be511d
5e8b24e967af633f22be511d- 1Afalse
- 2Bfalse
- 3Ctrue
- 4Dfalse
- Show Answer
- Workspace
- SingleChoice
Answer : 3. "C"
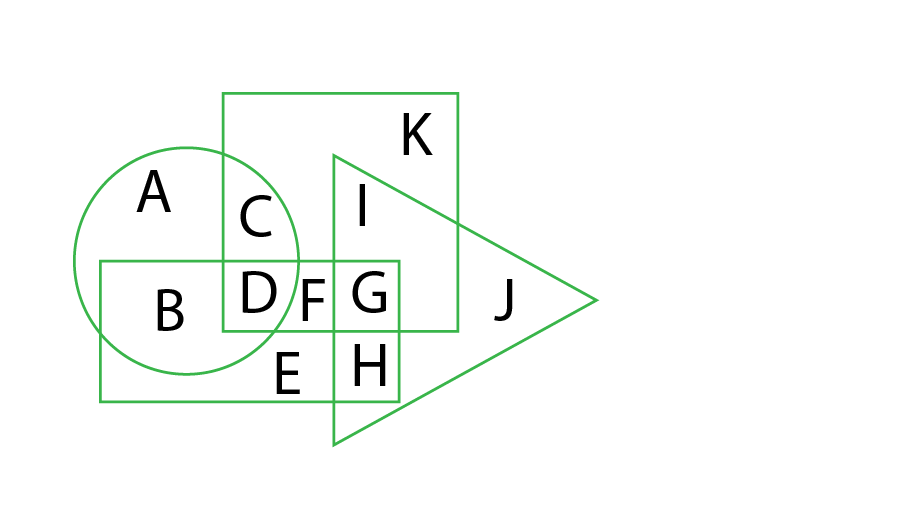
Q: In the following figure, rectangle represents Plumbers, circle represents Athletes, Triangle represents Gamers and Square represents Cricketers. Which set of letters represents those who are Athletes as well as Cricketers?
2034 05e7eedcea874324f6e0a7ed0
5e7eedcea874324f6e0a7ed0- 1CDtrue
- 2ABfalse
- 3FGfalse
- 4EHfalse
- Show Answer
- Workspace
- SingleChoice
Answer : 1. "CD "
Q:Direction: Study the following diagram and answer question based on it-
The diagram represents the favourite ice-cream flavours of kids in a society
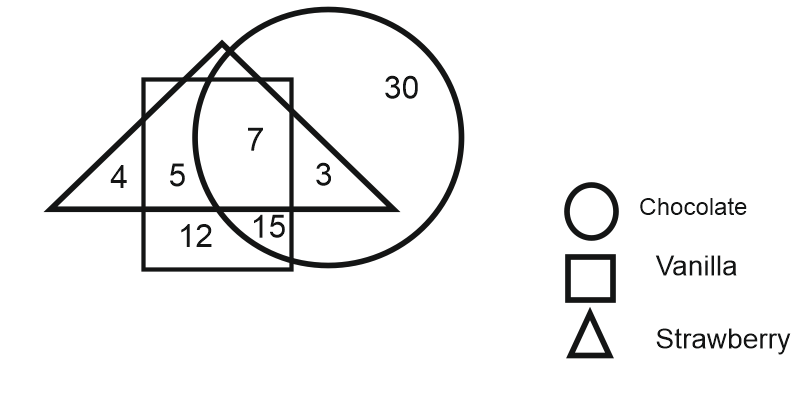
How many kids like strawberry but not vanilla?
1583 05e7c42049b7cd81e41fae756
5e7c42049b7cd81e41fae756- 14false
- 25false
- 37true
- 43false
- Show Answer
- Workspace
- SingleChoice
Answer : 3. "7"
Q:Direction: Study the following diagram and answer question based on it-
The diagram represents the favourite ice-cream flavours of kids in a society
The ratio of kids who like both chocolate and vanilla but not strawberry?
1112 05e7c3daa959a5b337ece0788
5e7c3daa959a5b337ece0788- 15false
- 27false
- 312false
- 415true
- Show Answer
- Workspace
- SingleChoice
Answer : 4. "15"
Q:Direction: Study the following diagram and answer question based on it-
The diagram represents the favourite ice-cream flavours of kids in a society
The ratio of kids who like vanilla to those who like chocolate is :
1092 05e7c40269b7cd81e41fae2d8
5e7c40269b7cd81e41fae2d8- 1false
- 2false
- 3false
- 4true
- Show Answer
- Workspace
- SingleChoice
Answer : 4. "
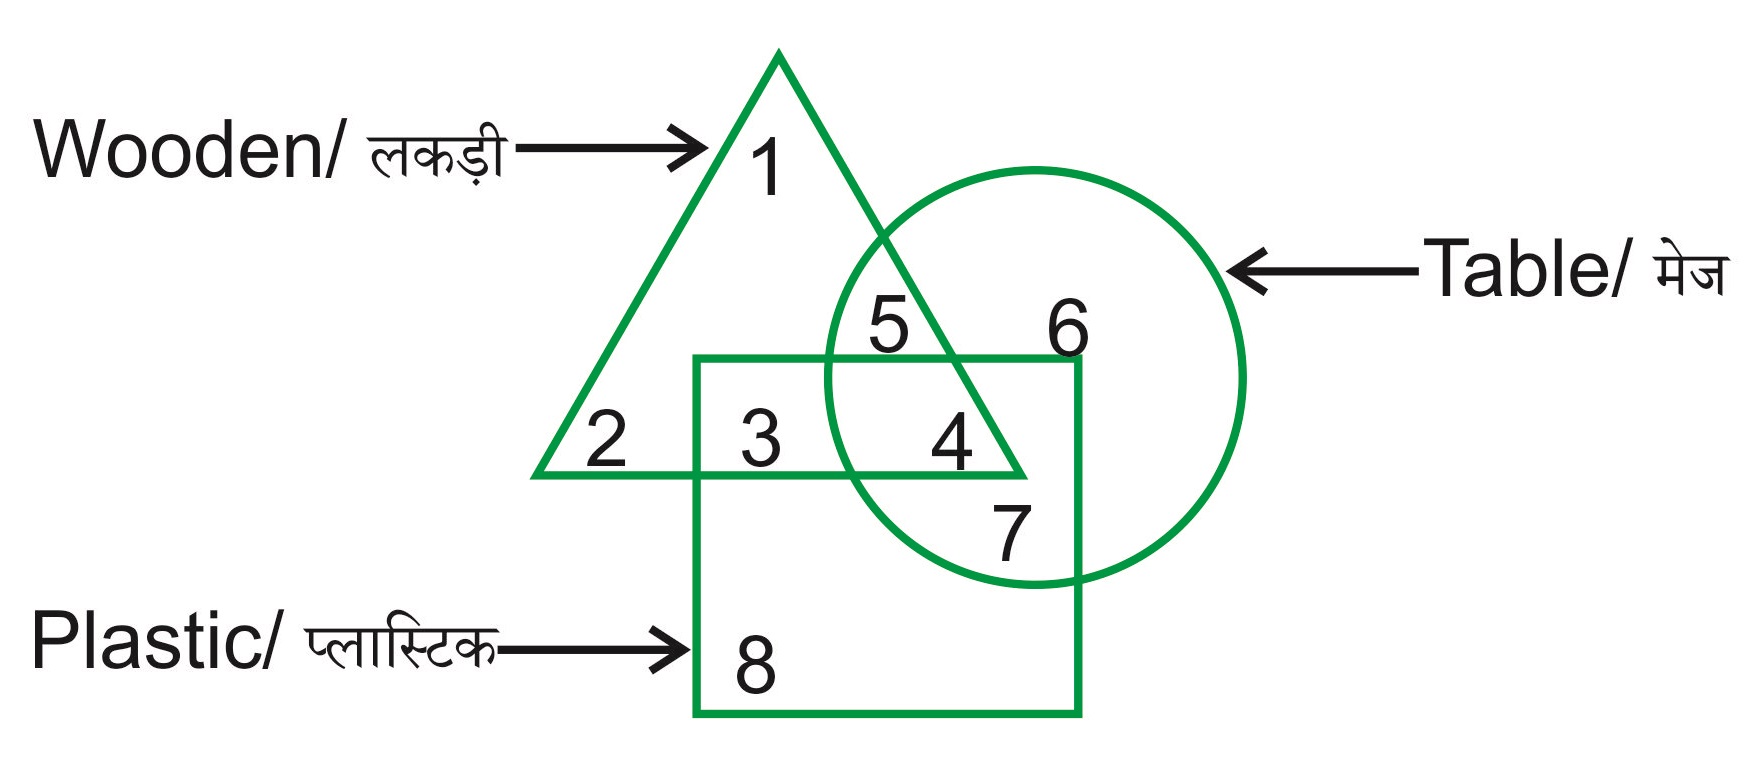
Q: In the given figure, which number represents plastic tablets which are wooden?
1834 05df9eb8c36644b47cbaf2e82
5df9eb8c36644b47cbaf2e82- 13false
- 25false
- 37false
- 44true
- Show Answer
- Workspace
- SingleChoice
Answer : 4. "4"
Q: In the each of the Questions are given three statements followed by three conclusions numbered I ,II and III. You have to take the given statements to be true even if they seem to be at variance from the commonly known facts. Read all the conclusion and then decide which of the given conclusions logically follows from the given statements disregarding commonly known facts.
Statements: Some hills are rivers.
Some rivers are deserts.
All desert are roads.
Conclusions: I. Some roads are rivers.
II. Some roads are hills.
III. Some deserts are hills.
8667 05d257381984e5e34002966a6
5d257381984e5e34002966a6Statements: Some hills are rivers.
Some rivers are deserts.
All desert are roads.
Conclusions: I. Some roads are rivers.
II. Some roads are hills.
III. Some deserts are hills.
- 1None follows.false
- 2Only I followtrue
- 3Only I and II followsfalse
- 4Only II and III followsfalse
- 5None follows.false
- Show Answer
- Workspace
- SingleChoice