Logical Venn Diagrams Questions Practice Question and Answer
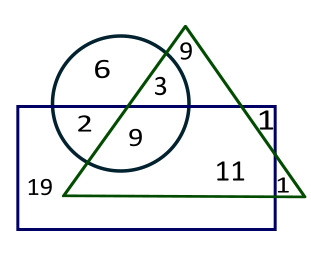
8 Q: In the given Venn diagram, the ‘circle’ represents ‘ladies’, the ‘triangle’ represents ‘teachers’, and the ‘rectangle’ represents ‘unmarried person’. The numbers given in the diagram represent the number of persons in that particular category.
How many married ladies are teachers?
917 05ffe992d4426b26e3e593dd3
5ffe992d4426b26e3e593dd3How many married ladies are teachers?
- 111false
- 26false
- 33true
- 49false
- Show Answer
- Workspace
- SingleChoice
Answer : 3. "3"
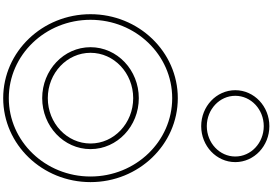
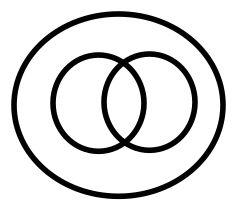
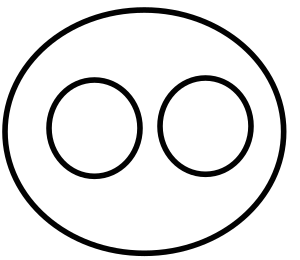
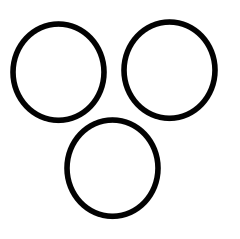
Q: Choose the Venn diagram that correctly represents the relationship between the squares below.
Color, red, yellow
911 05f686952e837355cae03dde4
5f686952e837355cae03dde4Color, red, yellow
- 1false
- 2false
- 3true
- 4false
- Show Answer
- Workspace
- SingleChoice
Answer : 3. "
"
Q:Study the following figure and answer the following questions.
1. Here the big triangle shows the artists.
2.Short represents triangular scientists.
3. The square refers to dancers.
4.The Circle refers to the doctors.
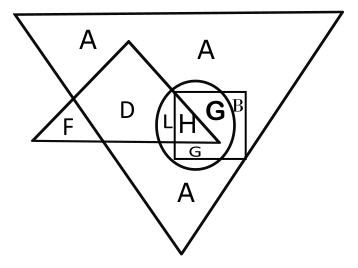
Which characters represent artists who are also dancers and doctors?
899 05f3cc618069d3f5fd51d0027
5f3cc618069d3f5fd51d0027- 1A and Dfalse
- 2G and Htrue
- 3C and Afalse
- 4C and Dfalse
- Show Answer
- Workspace
- SingleChoice
Answer : 2. "G and H"
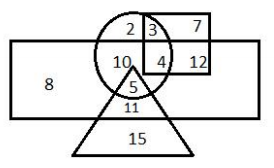
Q:Study the following information carefully and answer the question given below.
In a club of 30 people, all of them belong to at least one group - Chess, Drama and Art.6 people belong only to the Art group. 5 people belong to all three groups. 2 people have joined the Chess and the Art group but not the Drama group. 15 people belong to the Art group. 2 people have joined only the Chess group. 3 people have joined only the Drama group.
How many people have belonged to the Chess group?
898 0608b9d08cf70ad1835981b57
608b9d08cf70ad1835981b57In a club of 30 people, all of them belong to at least one group - Chess, Drama and Art.6 people belong only to the Art group. 5 people belong to all three groups. 2 people have joined the Chess and the Art group but not the Drama group. 15 people belong to the Art group. 2 people have joined only the Chess group. 3 people have joined only the Drama group.
- 121false
- 213false
- 319true
- 420false
- Show Answer
- Workspace
- SingleChoice
Answer : 3. "19 "
Q:Study the following figure and answer the following questions.
1. Here the big triangle shows the artists.
2.Short represents triangular scientists.
3. The square refers to dancers.
4.The Circle refers to the doctors.
Which letter represents scientists who are not artists?
874 05f3cc6e90716cd43e6d50e9c
5f3cc6e90716cd43e6d50e9c- 1Bfalse
- 2Dfalse
- 3Lfalse
- 4Ftrue
- Show Answer
- Workspace
- SingleChoice
Answer : 4. "F"
Q:Study the following information carefully and answer the question given below.
In a club of 30 people, all of them belong to at least one group - Chess, Drama and Art.6 people belong only to the Art group. 5 people belong to all three groups. 2 people have joined the Chess and the Art group but not the Drama group. 15 people belong to the Art group. 2 people have joined only the Chess group. 3 people have joined only the Drama group.
How many people have joined the Chess and the Drama group but not the Art group?
871 0608b9e16cf70ad1835981bc2
608b9e16cf70ad1835981bc2In a club of 30 people, all of them belong to at least one group - Chess, Drama and Art.6 people belong only to the Art group. 5 people belong to all three groups. 2 people have joined the Chess and the Art group but not the Drama group. 15 people belong to the Art group. 2 people have joined only the Chess group. 3 people have joined only the Drama group.
- 112false
- 210true
- 315false
- 413false
- Show Answer
- Workspace
- SingleChoice
Answer : 2. "10 "
Q: In the Venn diagram given below, the circle represents ‘North Indian’ the triangle represents ‘Pianists’ the rectangle represents ‘Males’ and the square represents ‘Engineers’. The numbers given in the diagram represents number of persons of that particular category. Who among the following is a female, North Indian, Engineer?
863 06049cf8cf4cbdc234861546a
6049cf8cf4cbdc234861546a- 15false
- 24false
- 33true
- 49false
- Show Answer
- Workspace
- SingleChoice
Answer : 3. "3"
Q:Study the following diagram and answer questions based on it.
The diagram represents the likes of kids of a class.
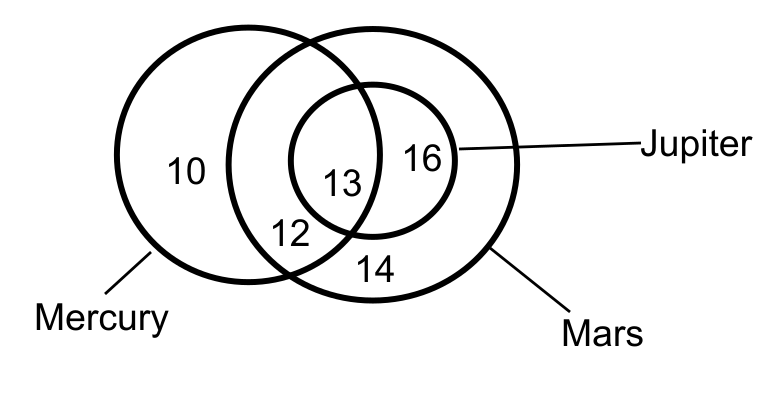
The ratio of kids who like only Mars to those who like all the three is
860 0607805c7c61d5c2ec94ce46a
607805c7c61d5c2ec94ce46aThe diagram represents the likes of kids of a class.
- 1false
- 2false
- 3false
- 4true
- Show Answer
- Workspace
- SingleChoice