Data Interpretation Question and Answer

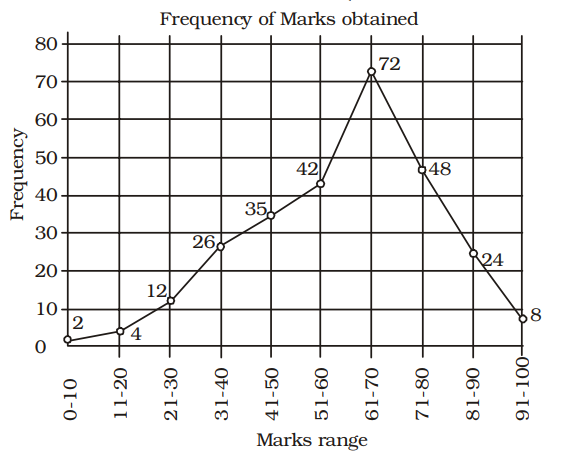
Directions: The marks obtained by 273 examinees are shown by the frequency polygon. Given that mean marks is 59.5. Study the frequency polygon and answer the given questions.
Percentage of the students who get above 80% marks is
(A) 11.28
(B) 11.72
(C) 9.81
(D) 10.53
Correct Answer : B
Directions: The marks obtained by 273 examinees are shown by the frequency polygon. Given that mean marks is 59.5. Study the frequency polygon and answer the given questions.
Percentage of the students who got marks above 60% and below 80% is
(A) 51.06
(B) 56.84
(C) 43.95
(D) 48.39
Correct Answer : C
Directions: The marks obtained by 273 examinees are shown by the frequency polygon. Given that mean marks is 59.5. Study the frequency polygon and answer the given questions.
If 40 is the pass marks, percentage of students failed is
(A) 16.11
(B) 17.25
(C) 14.56
(D) 15.84
Correct Answer : A
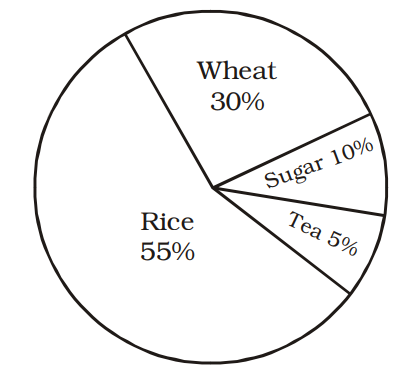
Directions : In the given pie-chart, the comparative study of the production of Rice, Wheat, Sugar and Tea of a country is given. Study the pie-chart and answer the following questions.
The production of rice and tea is more/greater than production of wheat by
(A) 75%
(B) 66.6%
(C) 50%
(D) 100%
Correct Answer : D
Directions : In the given pie-chart, the comparative study of the production of Rice, Wheat, Sugar and Tea of a country is given. Study the pie-chart and answer the following questions.
The central angle of percentage of wheat is
(A) 110°
(B) 108°
(C) 48°
(D) 98°
Correct Answer : B
Directions : In the given pie-chart, the comparative study of the production of Rice, Wheat, Sugar and Tea of a country is given. Study the pie-chart and answer the following questions.
The total production of rice, wheat, sugar and tea (in kgs) is 500000 kgs. The production of rice in the country is
(A) 275000 kg
(B) 27500 kg
(C) 175000 kg
(D) 395000 kg
Correct Answer : A
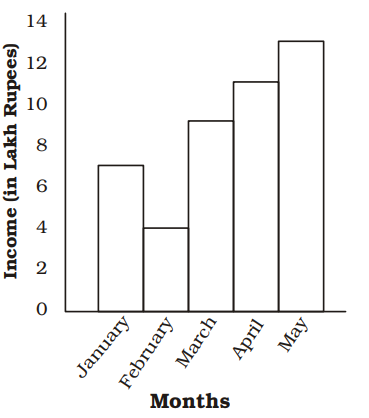
Directions: The bar graph given indicates the income of a firm. Study the graph and answer the questions given.
Which period shows a steady increase of income?
(A) February to April
(B) February to May
(C) March to May
(D) Insufficient data to predict
Correct Answer : D
Directions: The bar graph given indicates the income of a firm. Study the graph and answer the questions given.
During which month, the ratio of the income to that of the previous month is the largest?
(A) April
(B) May
(C) February
(D) March
Correct Answer : D
Directions: The bar graph given indicates the income of a firm. Study the graph and answer the questions given.
The income in May is how many times to that of February?
(A) 3.5
(B) 5
(C) 3.25
(D) 4
Correct Answer : C
Directions: The bar graph given indicates the income of a firm. Study the graph and answer the questions given.
The average monthly income of the firm (in lakh rupees) is :
(A) 6
(B) 8.8
(C) 7.6
(D) None of these
Correct Answer : B


