Data Interpretation Question and Answer

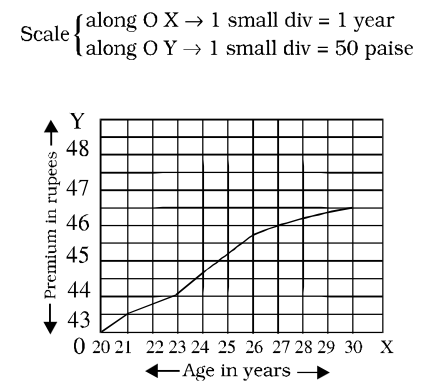
Directions: The graph given here shows the annual premiums of an insurance company, charged for an insurance of 1000 for individuals of different age-groups. Study the graph and answer each of the following questions:
The annual premium for a man aged 26 years for an insurance of ₹ 1000 is
(A) ₹ 46
(B) ₹ 44
(C) ₹ 45.7
(D) ₹ 45.25
Correct Answer : C
Directions: The graph given here shows the annual premiums of an insurance company, charged for an insurance of 1000 for individuals of different age-groups. Study the graph and answer each of the following questions:
What is the age of a person whose premium is ₹ 44.60 for an insurance of ₹ 1000?
(A) 24 years
(B) 45 years
(C) 23 years
(D) 23.5 years
Correct Answer : A
Directions: The graph given here shows the annual premiums of an insurance company, charged for an insurance of 1000 for individuals of different age-groups. Study the graph and answer each of the following questions:
The premium for a man aged 22 years for an insurance of ₹ 10,000 is
(A) 43.75
(B) 437.50
(C) 435
(D) 440
Correct Answer : B
Directions: The graph given here shows the annual premiums of an insurance company, charged for an insurance of 1000 for individuals of different age-groups. Study the graph and answer each of the following questions:
What percent of the premium is increased if a man aged 30 years is insured for ₹ 1000 instead of a man aged 23 years?
(A) 6.24%
(B) 6%
(C) 4.75%
(D) 5.68%
Correct Answer : D
Directions: The graph given here shows the annual premiums of an insurance company, charged for an insurance of 1000 for individuals of different age-groups. Study the graph and answer each of the following questions:
Each of two persons aged 21 years and 23 years is insured for ₹ 1,00,000. The difference between their annual premiums will be
(A) 25
(B) 20
(C) 100
(D) 50
Correct Answer : D
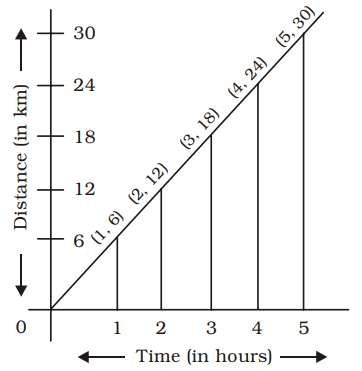
Directions: The graph given here shows a car following the linear path with uniform speed. Study the graph and answer the questions.
The speed of the car is
(A) 18 km/hr
(B) 24 km/hr
(C) 12 km/hr
(D) 6 km/hr
Correct Answer : D
Directions: The graph given here shows a car following the linear path with uniform speed. Study the graph and answer the questions.
The speed of the car (in metres per minute) is
(A) 600
(B) 1000
(C) 60
(D) 100
Correct Answer : D
Directions: The graph given here shows a car following the linear path with uniform speed. Study the graph and answer the questions.
The distance travelled by the car in 4.5 hours is
(A) 36 km
(B) 40 km
(C) 27 km
(D) 30 km
Correct Answer : C
Directions: The graph given here shows a car following the linear path with uniform speed. Study the graph and answer the questions.
The car covers a distance of 15 kilometres in
(A) 1.5 hours
(B) 2.5 hours
(C) 3 hours
(D) 2 hours
Correct Answer : B
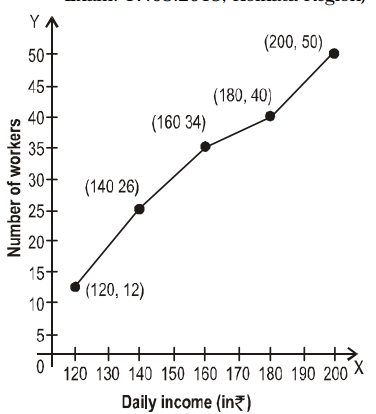
Directions: The graph given below shows the daily income of 50 workers in a factory. Study the graph and answer the questions
What percentage of the factory workers earn between 150 and 180?
(A) 6%
(B) 16%
(C) 12%
(D) 20%
Correct Answer : B


