Data Interpretation Question and Answer


Directions: The graph given below shows the daily income of 50 workers in a factory. Study the graph and answer the questions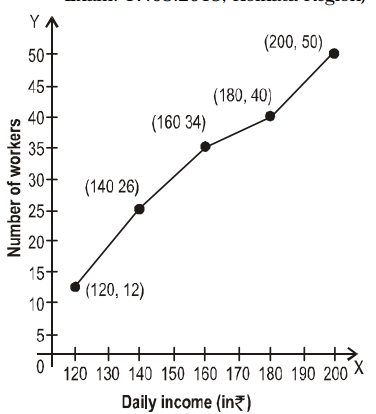
The median wages in the factory is
(A) 150
(B) 160
(C) 140
(D) 138
Correct Answer : B
About author

Vikram Singh
Providing knowledgable questions of Reasoning and Aptitude for the competitive exams.
Read more articles