Data Interpretation Questions Practice Question and Answer
8 Q:Study the given pie chart and answer the question that follows.
Distribution (Degree wise) of students studying in schools A, B, C, D and E
Total Number of students =9000
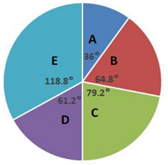
The number of students in School E exceeds the total number of students in school A and B by x, where x lies between:
853 060532b11a01bc44789ae80ef
60532b11a01bc44789ae80efDistribution (Degree wise) of students studying in schools A, B, C, D and E
Total Number of students =9000
- 1440 and 460true
- 2420 and 440false
- 3460 and 480false
- 4400 and 420false
- Show Answer
- Workspace
- SingleChoice
Answer : 1. "440 and 460"
Q:Study the given pie chart and answer the question that follows.
Distribution (Degree wise) of students studying in schools A, B, C, D and E
Total Number of students =9000
If the ratio of the number of boys to that of girls in school C is 6 : 5 and that in school B is 7 : 11,then what is the ratio of the number of boys in school C to the number of girls in school B?
774 060532a75528a962d2e430021
60532a75528a962d2e430021Distribution (Degree wise) of students studying in schools A, B, C, D and E
Total Number of students =9000
- 110 : 11false
- 211 : 10false
- 312 : 11true
- 411: 12false
- Show Answer
- Workspace
- SingleChoice
Answer : 3. "12 : 11"
Q:Study the given graph and answer the question that follows.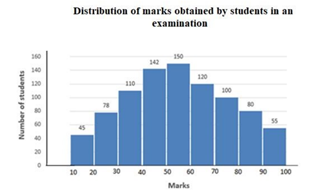
The total number of students obtaining less than 50 marks is what percentage more than the total number of students obtaining 60 marks or more ( correct to one decimal place).
739 060532740a37d522d6c19c1cd
60532740a37d522d6c19c1cd- 16.8false
- 26.2false
- 34.4false
- 45.6true
- Show Answer
- Workspace
- SingleChoice
Answer : 4. "5.6"
Q:Study the given graph and answer the question that follows.
If 60% of the total number of students obtaining 50 marks or more but less than 70 marks are girls and 55 % of the total number of students obtaining 70 marks or more but less than 90 marks are also girls. Then the total number of girls obtaining 50 marks or more but less than 90 marks is:
847 0605326834999e13f2a6d25ae
605326834999e13f2a6d25ae- 1261true
- 2207false
- 3236false
- 4257false
- Show Answer
- Workspace
- SingleChoice
Answer : 1. "261"
Q:Directions : Given line graph shows the data of male & female population in 5 different cities. Read the data carefully and answer the questions.
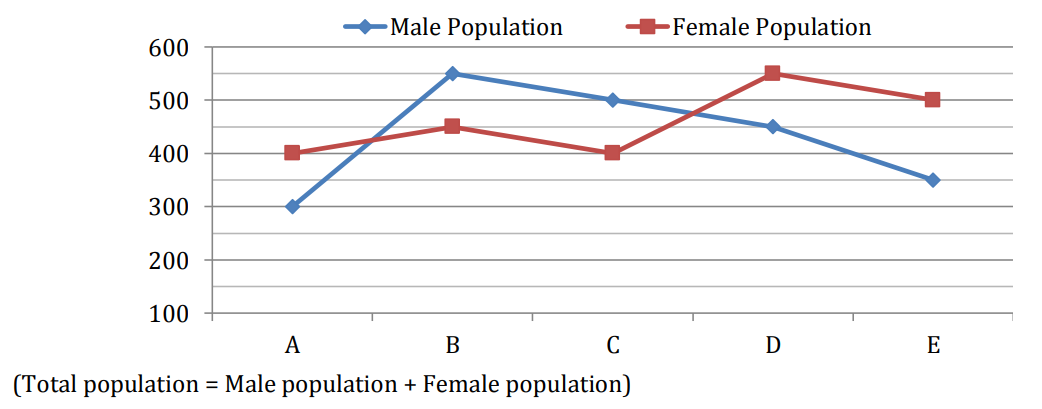
In city B & C, ratio of postgraduates is 7 : 8. Total population who is postgraduate in city B is equal to total population of city A. find ratio of non-postgraduate population in city B to that of city C.
1699 06040896ab0e8d85dadab69fc
6040896ab0e8d85dadab69fc- 17 : 3false
- 28 : 3false
- 37 : 1false
- 43 : 1true
- 58 : 1false
- Show Answer
- Workspace
- SingleChoice
Answer : 4. "3 : 1"
Q:Directions : Given line graph shows the data of male & female population in 5 different cities. Read the data carefully and answer the questions.
What percent of Female population in city C is male population in city E?
1885 0604088ff0634b252a6b984e6
604088ff0634b252a6b984e6- 190.2%false
- 287.5%true
- 384.5%false
- 485.5%false
- 5114.2%false
- Show Answer
- Workspace
- SingleChoice
Answer : 2. "87.5%"
Q:Directions : Given line graph shows the data of male & female population in 5 different cities. Read the data carefully and answer the questions.
What is average of male population in all cities?
1001 06040888bb0e8d85dadab65d8
6040888bb0e8d85dadab65d8- 1465false
- 2455false
- 3440false
- 4460false
- 5430true
- Show Answer
- Workspace
- SingleChoice
Answer : 5. "430"
Q:Directions : Given line graph shows the data of male & female population in 5 different cities. Read the data carefully and answer the questions.
If in city A, the ratio of male graduates to female graduates is 3 : 4 and total graduates in the city are 70% of total population. Find population of females who are not graduate.
1384 060408834e759ac364c93f3c5
60408834e759ac364c93f3c5- 1120true
- 250false
- 390false
- 470false
- 5135false
- Show Answer
- Workspace
- SingleChoice