Data Interpretation Questions Practice Question and Answer
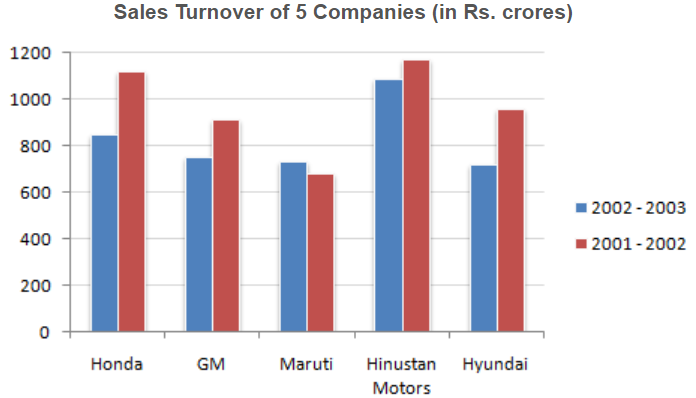
8 Q:Study the following bar chart and answer the questions carefully.

Which of the companies shows the maximum percentage difference in sales turnover between the two years ?
1056 05fd33b8ec46a213fc5c4fe25
5fd33b8ec46a213fc5c4fe25
- 1Hondafalse
- 2GMfalse
- 3Hyundaitrue
- 4Marutifalse
- 5None of thesefalse
- Show Answer
- Workspace
- SingleChoice
Answer : 3. "Hyundai"
Q:Study the following bar chart and answer the questions carefully.

What is the absolute change in overall sales turnover of the five companies together between 2001 - 2002 and 2002 - 2003 ?
1421 05fd33b3cc46a213fc5c4fc25
5fd33b3cc46a213fc5c4fc25
- 1712.43true
- 2142.48false
- 3683.53false
- 4655.56false
- 5None of thesefalse
- Show Answer
- Workspace
- SingleChoice
Answer : 1. "712.43"
Q:Study the following bar chart and answer the questions carefully.

What is the percentage change in the overall sales turnover of the five companies together between 2001 - 2002 and 2002 - 2003 ?
1171 05fd33a80eddcb86a7ee3ab40
5fd33a80eddcb86a7ee3ab40
- 117.21 %false
- 214.68 %true
- 312.67 %false
- 421.24 %false
- 522.33 %false
- Show Answer
- Workspace
- SingleChoice
Answer : 2. "14.68 %"
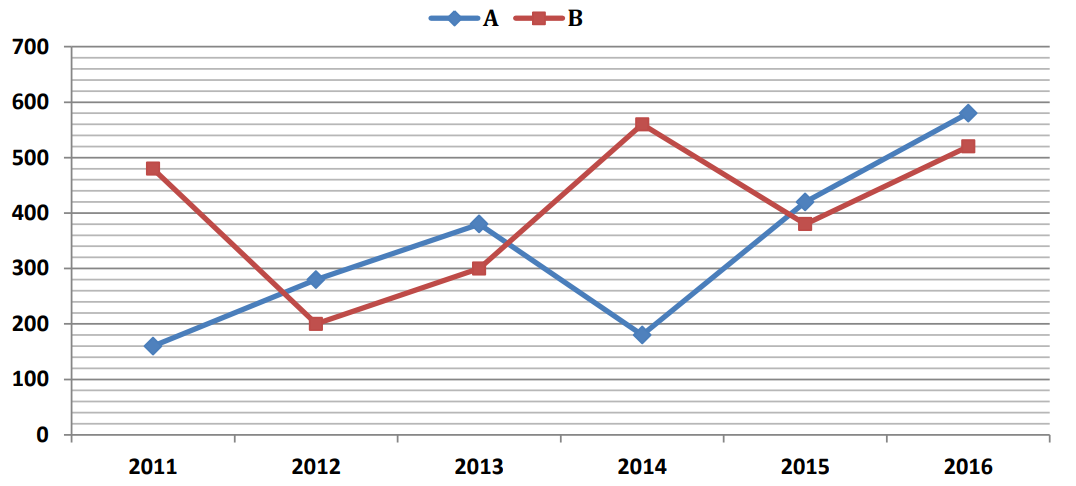
Q:Directions :- Refer the graph and answer the given questions.
The following line graph shows the number of products sold by company A and B during six years.

The number of products sold by B increased by what percent from 2011 and 2014 ?
808 05fd32f2bd82ef86315b71216
5fd32f2bd82ef86315b71216The following line graph shows the number of products sold by company A and B during six years.

- 1false
- 2true
- 3false
- 4false
- 5false
- Show Answer
- Workspace
- SingleChoice
Answer : 2. "
Q:Directions :- Refer the graph and answer the given questions.
The following line graph shows the number of products sold by company A and B during six years.

Out of the total number of products sold by A and B together in 2011, only 20% are defected. What is the total number of defected products sold by A and B together in 2011?
758 05fd32e77956cb668fbdd9206
5fd32e77956cb668fbdd9206The following line graph shows the number of products sold by company A and B during six years.

- 1228false
- 2128true
- 3160false
- 4148false
- 5138false
- Show Answer
- Workspace
- SingleChoice
Answer : 2. "128"
Q:Directions :- Refer the graph and answer the given questions.
The following line graph shows the number of products sold by company A and B during six years.

What is the ratio of the total number of products sold by A and B together in 2012 to the total number of products sold in these two companies together in 2015 ?
971 05fd32c9ac46a213fc5c46b19
5fd32c9ac46a213fc5c46b19The following line graph shows the number of products sold by company A and B during six years.

- 112 : 25false
- 23 : 5true
- 34 : 3false
- 45 : 3false
- 5None of thesefalse
- Show Answer
- Workspace
- SingleChoice
Answer : 2. "3 : 5"
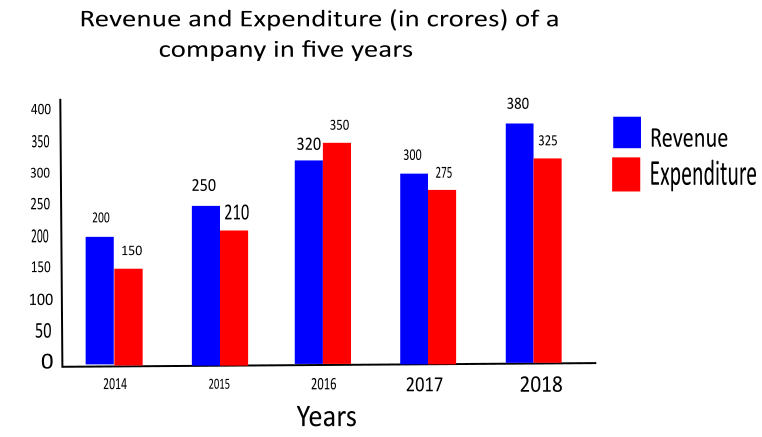
Q:Study the given graph and answer the question that follows.

What is the ratio of the total expenditure in 2015 and 2016 to the total revenue of the company in 2016 and 2018?
1375 05fbf78fa4f2f6c622be787d2
5fbf78fa4f2f6c622be787d2
- 16 : 7false
- 219: 20false
- 34 : 5true
- 411 : 20false
- Show Answer
- Workspace
- SingleChoice
Answer : 3. "4 : 5"
Q:Study the given graph and answer the question that follows.

In how many years was the revenue of the company more than 1.2 times the average expenditure over the given five years?
779 05fbf76cf2e911753dd59d872
5fbf76cf2e911753dd59d872
- 14false
- 22true
- 31false
- 43false
- Show Answer
- Workspace
- SingleChoice

