Data Interpretation Questions Practice Question and Answer
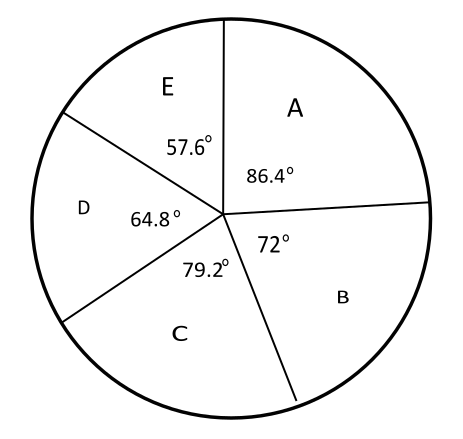
8 Q:Study the given pie chart and answer the question that follows.
Break-up (degree-wise) of the number of students in five schools (A, B, C, D and E) in a city.
Total number of students =5200

If the ratio of the number of boys to that of girls in school B is 7:6 and the ratio of number of boys to that of girls in school D is 4 : 5, then what is the ratio of number of boys in B to that of girls in D?
762 05fbf75014d67184d07c60ab1
5fbf75014d67184d07c60ab1Break-up (degree-wise) of the number of students in five schools (A, B, C, D and E) in a city.
Total number of students =5200

- 112 : 13false
- 213 : 12false
- 314 : 13true
- 413 : 14false
- Show Answer
- Workspace
- SingleChoice
Answer : 3. "14 : 13"
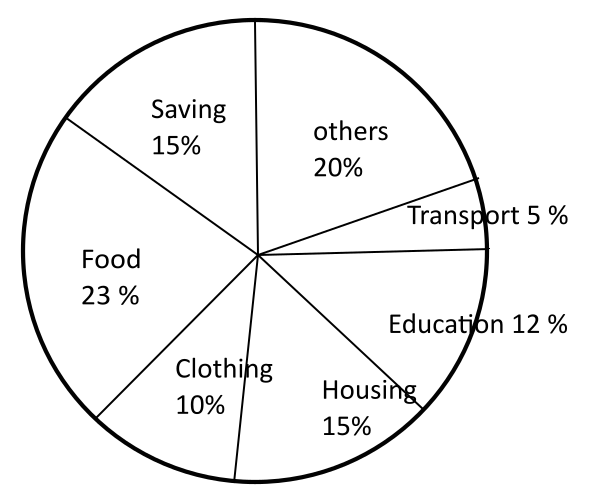
Q:Pie chart shows the percent of money spent by family on various item during 1999. Study the graph and answer these questions.

Graph shows that the maximum amount was spent on
1030 05fb4e5bfbf36696eb82682fb
5fb4e5bfbf36696eb82682fb
- 1Foodtrue
- 2Clothingfalse
- 3Housingfalse
- 4Othersfalse
- Show Answer
- Workspace
- SingleChoice
Answer : 1. "Food"
Q:Pie chart shows the percent of money spent by family on various item during 1999. Study the graph and answer these questions.

The ratio of the total amount of money spent on housing to that spent on education was
1086 05fb4e543bf36696eb8268137
5fb4e543bf36696eb8268137
- 15:2false
- 22:5false
- 34:5false
- 45:4true
- Show Answer
- Workspace
- SingleChoice
Answer : 4. " 5:4"
Q:Pie chart shows the percent of money spent by family on various item during 1999. Study the graph and answer these questions.

If the total amount spent was Rs. 46,000, how much money was spent on clothing and housing together?
937 05fb4e4ff488efb77b438030b
5fb4e4ff488efb77b438030b
- 1Rs. 1150false
- 2Rs. 11500true
- 3Rs. 10000false
- 4Rs. 15000false
- Show Answer
- Workspace
- SingleChoice
Answer : 2. "Rs. 11500"
Q:Pie chart shows the percent of money spent by family on various item during 1999. Study the graph and answer these questions.

If the total amount spent during the year 1999 was Rs. 46000, the amount spent on food was :
2161 05fb4e3e9488efb77b437fdc8
5fb4e3e9488efb77b437fdc8
- 1Rs. 2000false
- 2Rs. 2300false
- 3Rs. 11500false
- 4Rs. 10580true
- Show Answer
- Workspace
- SingleChoice
Answer : 4. "Rs. 10580"
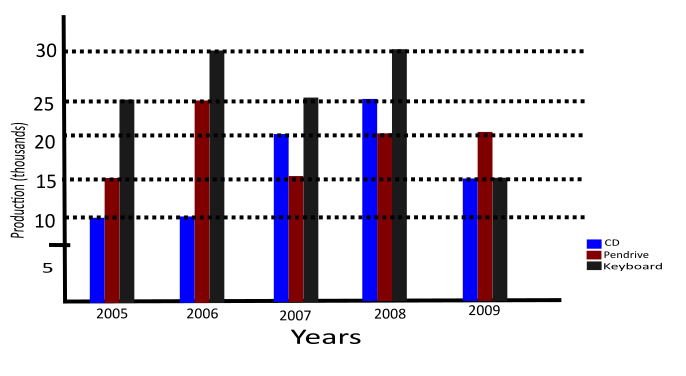
Q:In the following diagram, three different products (in thousands) produced by a company in 5 years are given and after studying them carefully, answer the following questions.
Three products produced by a company in different years (in thousands)

What will be the average of the Key board produced in the year 2006 and year 2008?
748 05faa5e20086f7f6870549c78
5faa5e20086f7f6870549c78
- 130,000true
- 235,000false
- 360,000false
- 450,000false
- Show Answer
- Workspace
- SingleChoice
Answer : 1. "30,000"
Q:In the following diagram, three different products (in thousands) produced by a company in 5 years are given and after studying them carefully, answer the following questions.
Three products produced by a company in different years (in thousands)

What is the difference between the CD produced between the year 2007 and the year 2009?
721 05faa5dc15ebf3a64427b0eaa
5faa5dc15ebf3a64427b0eaa
- 120,000false
- 215,000true
- 35,000false
- 4500false
- Show Answer
- Workspace
- SingleChoice
Answer : 2. "15,000"
Q:In the following diagram, three different products (in thousands) produced by a company in 5 years are given and after studying them carefully, answer the following questions.
Three products produced by a company in different years (in thousands)

What is the average number of pan-drives produced by the company in all the years?
733 05faa5d67ece37f513633591b
5faa5d67ece37f513633591b
- 132,000false
- 221,000true
- 334,000false
- 410,500false
- Show Answer
- Workspace
- SingleChoice

