Data Interpretation Questions Practice Question and Answer
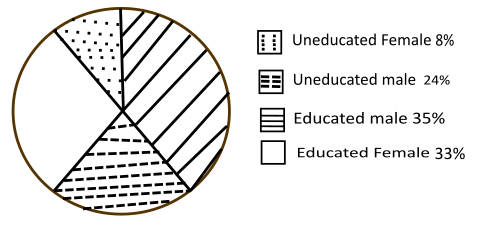
8 Q:The following chart depicts the percentage of Educated and Uneducated men and women in a city with a population of 2,50,000.

How many of these women are Uneducated?
825 05f9f9c064a02db7b99b229e3
5f9f9c064a02db7b99b229e3
- 120,000true
- 235,000false
- 340,000false
- 425,000false
- Show Answer
- Workspace
- SingleChoice
Answer : 1. "20,000"
Q:The following chart depicts the percentage of Educated and Uneducated men and women in a city with a population of 2,50,000.

Differentiate between the number of Educated males and Educated females.
895 05f9f9b8cd265227c88cdde25
5f9f9b8cd265227c88cdde25
- 15,000true
- 2500false
- 375,000false
- 41,500false
- Show Answer
- Workspace
- SingleChoice
Answer : 1. "5,000"
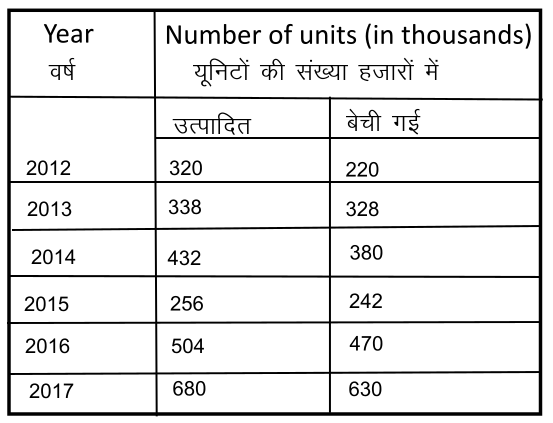
Q:The following table shows the number of units of product produced and sold by a company during six years.

What is the difference between the number of units produced in 2017 and the number of units sold in 2014?
819 05f6d9bcdf9079a64e3bfd8e6
5f6d9bcdf9079a64e3bfd8e6
- 1320false
- 2340false
- 390false
- 4300true
- Show Answer
- Workspace
- SingleChoice
Answer : 4. "300"
Q:The following table shows the number of units of product produced and sold by a company during six years.

In which two years were the maximum units sold?
822 05f6d9b77ec13dd7480045efe
5f6d9b77ec13dd7480045efe
- 12013, 2017false
- 22016, 2017true
- 32013, 2014false
- 42015, 2017false
- Show Answer
- Workspace
- SingleChoice
Answer : 2. "2016, 2017"
Q:The following table shows the number of units of product produced and sold by a company during six years.

What is the percentage of the number of units produced in 2017 more than the number of units produced since 2012?
755 05f6d9b315256e8407c2dd4ea
5f6d9b315256e8407c2dd4ea
- 1114 %false
- 2112.5 %true
- 3114.25%false
- 4113 %false
- Show Answer
- Workspace
- SingleChoice
Answer : 2. "112.5 %"
Q:The following table shows the number of units of product produced and sold by a company during six years.

Find the ratio of the total number of units sold in 2013 and 2015 to the number of units sold in 2015 and 2016?
916 05f6d9ac55256e8407c2dd134
5f6d9ac55256e8407c2dd134
- 129 : 38false
- 214 : 19false
- 33 : 4true
- 47 : 9false
- Show Answer
- Workspace
- SingleChoice
Answer : 3. "3 : 4"
Q:The following Charts shows the amount of grain exported (in million kg ) by a country during 2013–18.

In which year did jute exports become the highest?
1096 05f645298becdf06fd26560ad
5f645298becdf06fd26560ad
- 12014false
- 22016false
- 32018true
- 42017false
- Show Answer
- Workspace
- SingleChoice
Answer : 3. "2018"
Q:The following Charts shows the amount of grain exported (in million kg ) by a country during 2013–18.

What is the maximum per cent more than the minimum export in the given period?
955 05f64523eca371c728314febd
5f64523eca371c728314febd
- 1100 %true
- 250 %false
- 375 %false
- 466.67 %false
- Show Answer
- Workspace
- SingleChoice

