Data Interpretation Questions Practice Question and Answer
8 Q:The following chart depicts the percentage of Educated and Uneducated men and women in a city with a population of 2,50,000.
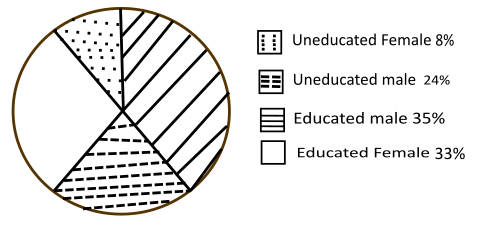
How many of these women are Uneducated?
823 05f9f9c064a02db7b99b229e3
5f9f9c064a02db7b99b229e3- 120,000true
- 235,000false
- 340,000false
- 425,000false
- Show Answer
- Workspace
- SingleChoice
Answer : 1. "20,000"
Q:The following table shows the number of units of product produced and sold by a company during six years.
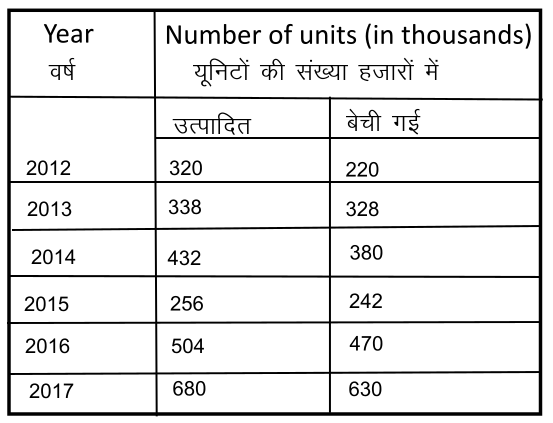
In which two years were the maximum units sold?
822 05f6d9b77ec13dd7480045efe
5f6d9b77ec13dd7480045efe- 12013, 2017false
- 22016, 2017true
- 32013, 2014false
- 42015, 2017false
- Show Answer
- Workspace
- SingleChoice
Answer : 2. "2016, 2017"
Q:Direction: Study the following information to answer the questions.
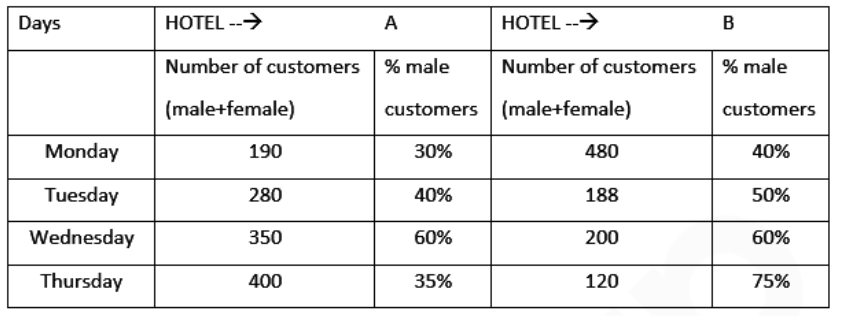
The number of customers (male + female) in hotel A and B are increased by 50% and 15% respectively from Thursday to Saturday. If the total number of female customers in hotel A and B together was equal on Thursday and Saturday, what was the total number of male customers in hotel A and B together on Saturday?
821 0609d1aa3e941dd6183d638e3
609d1aa3e941dd6183d638e3- 1448true
- 2452false
- 3458false
- 4438false
- 5442false
- Show Answer
- Workspace
- SingleChoice
Answer : 1. "448"
Q:Directions: Answer the questions based on the information given below:
The following line graph shows revenue and expenditure of company A for 5 years (in Lakhs):
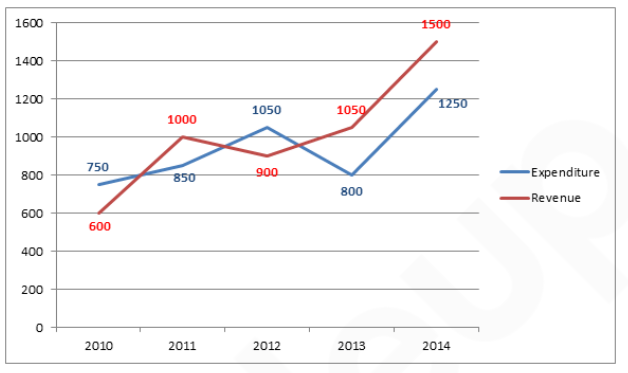
What is the difference between revenue and expenditure of company A over the year?
820 060a4de80b33a50608a41d237
60a4de80b33a50608a41d237The following line graph shows revenue and expenditure of company A for 5 years (in Lakhs):
- 1200 lakhsfalse
- 2300 lakhsfalse
- 3350 lakhstrue
- 4250 lakhsfalse
- 5None of thesefalse
- Show Answer
- Workspace
- SingleChoice
Answer : 3. "350 lakhs "
Q:The following table shows the number of units of product produced and sold by a company during six years.
What is the difference between the number of units produced in 2017 and the number of units sold in 2014?
818 05f6d9bcdf9079a64e3bfd8e6
5f6d9bcdf9079a64e3bfd8e6- 1320false
- 2340false
- 390false
- 4300true
- Show Answer
- Workspace
- SingleChoice
Answer : 4. "300"
Q:The line graph shows the number of vacancies of accountants in a certain company. Study the diagram and answer the following questions.
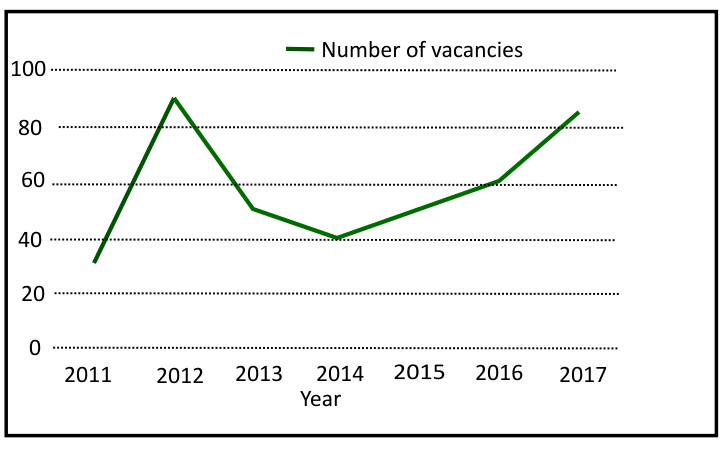
In which year maximum vacancies produced?
817 05f5b0d2869ed13038c1a8a01
5f5b0d2869ed13038c1a8a01- 12012, 2017true
- 22014, 2016false
- 32013, 2016false
- 4None of thesefalse
- Show Answer
- Workspace
- SingleChoice
Answer : 1. "2012, 2017"
Q:Study the given pie chart and answer the question that follows.
Distribution (Degree wise) of students studying in schools A, B, C, D and E
Total Number of students =9000
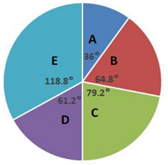
The total number of students in schools D and E is what percentage more than the total number of students in school B and C?
816 060532d02a37d522d6c19d671
60532d02a37d522d6c19d671Distribution (Degree wise) of students studying in schools A, B, C, D and E
Total Number of students =9000
- 125true
- 220false
- 330false
- 435false
- Show Answer
- Workspace
- SingleChoice
Answer : 1. "25"
Q:Directions : The graph shows the demand and production of different companies. Study the graph and answer the following questions.
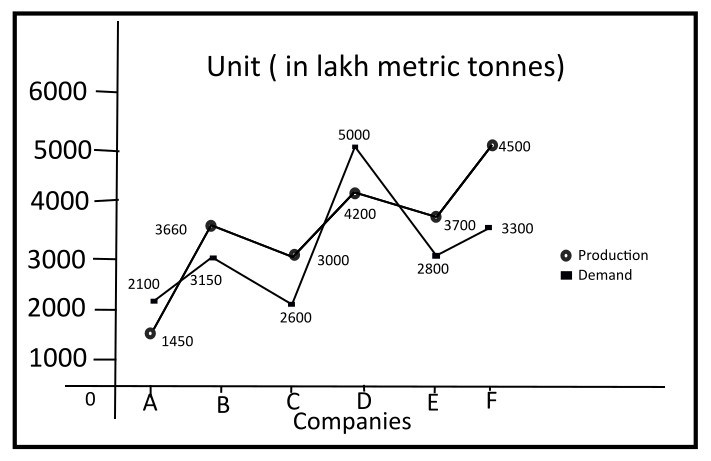
What is the lowest production company?
811 05f4f73630c72eb2349337ad6
5f4f73630c72eb2349337ad6- 1Cfalse
- 2Dfalse
- 3Ffalse
- 4Atrue
- Show Answer
- Workspace
- SingleChoice