Data Interpretation Questions Practice Question and Answer
8 Q:The given pie chart shows the percentage of students enrolled for the courses A, B, C, D and E in a university and the table shows the percentage of students that passed, out of the enrolled students.
Total Students=60,000
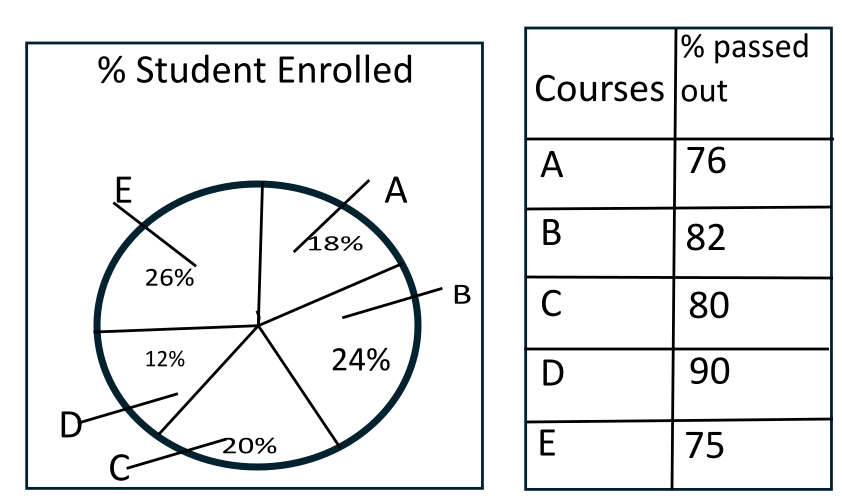
How many students passed in Course C?
815 05ffc357323210f22f33037a7
5ffc357323210f22f33037a7Total Students=60,000
- 18800false
- 29600true
- 37300false
- 46800false
- Show Answer
- Workspace
- SingleChoice
Answer : 2. "9600"
Q:Directions :- Refer the graph and answer the given questions.
The following line graph shows the number of products sold by company A and B during six years.
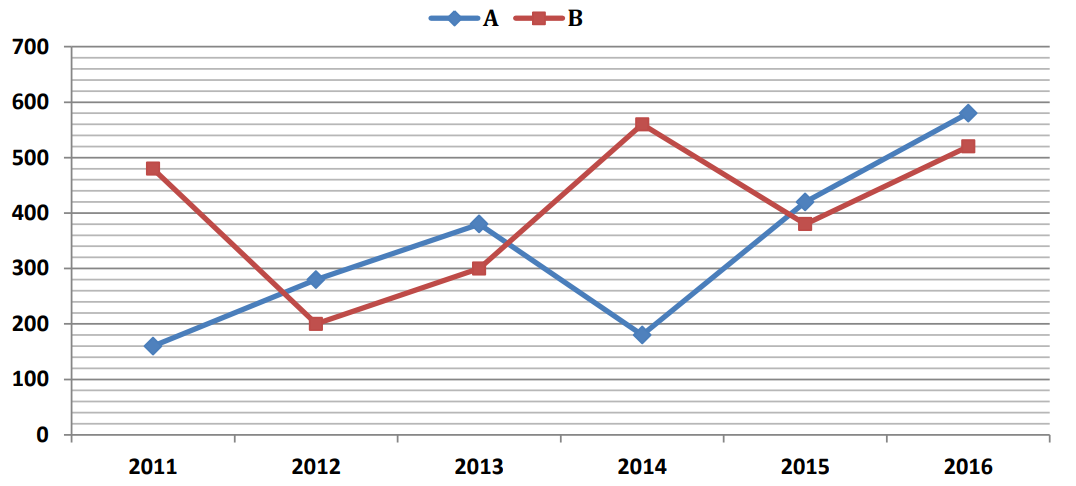
The number of products sold by A in 2014 is what per cent of the number of products sold by B in 2013?
814 05fd32ec9c46a213fc5c470f1
5fd32ec9c46a213fc5c470f1The following line graph shows the number of products sold by company A and B during six years.
- 160%true
- 250%false
- 348%false
- 456%false
- 5None of thesefalse
- Show Answer
- Workspace
- SingleChoice
Answer : 1. "60%"
Q:Directions : The graph shows the demand and production of different companies. Study the graph and answer the following questions.
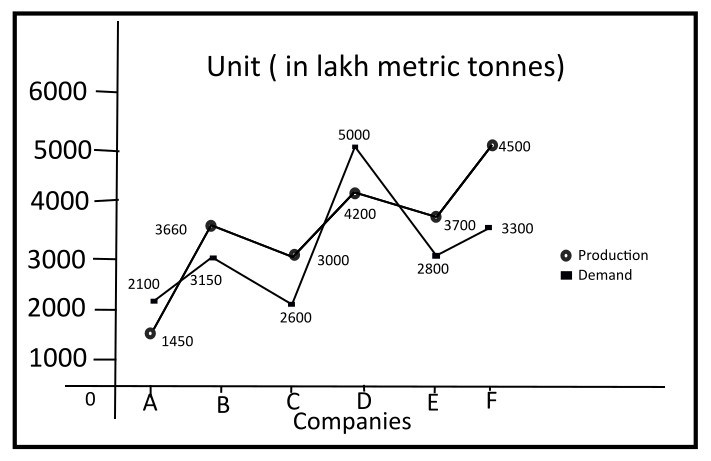
What is the lowest production company?
813 05f4f73630c72eb2349337ad6
5f4f73630c72eb2349337ad6- 1Cfalse
- 2Dfalse
- 3Ffalse
- 4Atrue
- Show Answer
- Workspace
- SingleChoice
Answer : 4. "A"
Q:Direction: Study the line graph carefully to answer the following questions.
Line graph shows the production (in thousand units) and percentage of exported mobiles, computers and laptops.
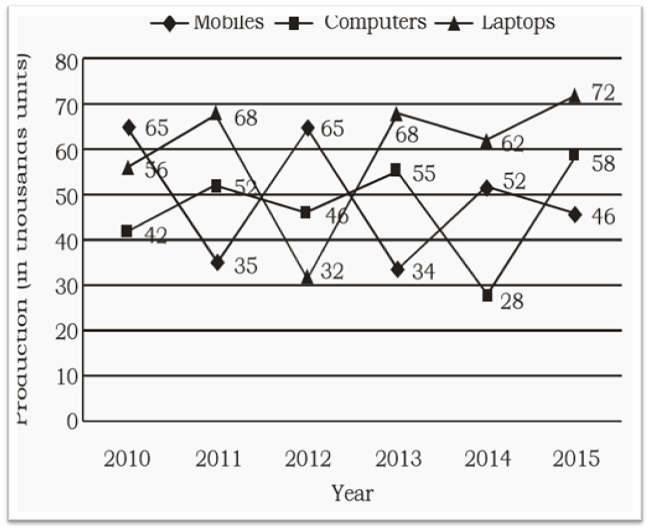
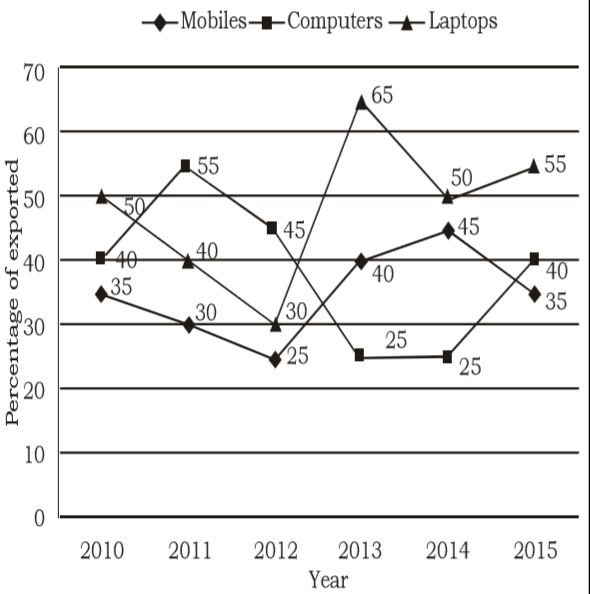
Find the total number Mobiles exported in the year 2011, 2013 and 2015 together?
809 05e9d1c5e0a165a45b7580c29
5e9d1c5e0a165a45b7580c29Line graph shows the production (in thousand units) and percentage of exported mobiles, computers and laptops.
- 140,200true
- 242,010false
- 341,998false
- 440,960false
- 5None of thesefalse
- Show Answer
- Workspace
- SingleChoice
Answer : 1. "40,200 "
Q:Directions :- Refer the graph and answer the given questions.
The following line graph shows the number of products sold by company A and B during six years.
The number of products sold by B increased by what percent from 2011 and 2014 ?
808 05fd32f2bd82ef86315b71216
5fd32f2bd82ef86315b71216The following line graph shows the number of products sold by company A and B during six years.
- 1false
- 2true
- 3false
- 4false
- 5false
- Show Answer
- Workspace
- SingleChoice
Answer : 2. "
Q:Study the graphs to answer these questions.
The pie chart shows the percentage of graduate employees in various department of M/S XYZ limited.
The employees in various departments of M/S. XYZ limited. Other than graduate employees are those employees who are either post graduate or undergraduates.

What is the approximate ratio of number of other than graduate employees in Finance to graduate employees in Administration department?
804 0601143f27fb81d03bf7e035b
601143f27fb81d03bf7e035bThe pie chart shows the percentage of graduate employees in various department of M/S XYZ limited.
The employees in various departments of M/S. XYZ limited. Other than graduate employees are those employees who are either post graduate or undergraduates.
- 16 :37false
- 237 : 6true
- 319 : 74false
- 474 : 19false
- Show Answer
- Workspace
- SingleChoice
Answer : 2. "37 : 6"
Q:The given table represents the number of engineers recruited by four companies A, B, C and D over the years. Study the table carefully and answer the question that follow.
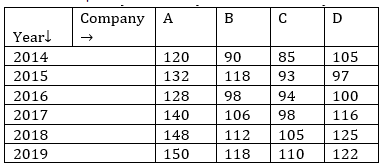
The total number of engineers recruited by company A in 2014 to 2017 is what percentage more than the total number of engineers recruited by all four companies in 2019?
804 060927140bef26c5d152b8bfe
60927140bef26c5d152b8bfe- 13.5false
- 22.5false
- 33false
- 44true
- Show Answer
- Workspace
- SingleChoice
Answer : 4. "4"
Q:Direction: The following table shows the number of students of 7 colleges A, B, C, D, E, F, G participating in extra-curricular activities :
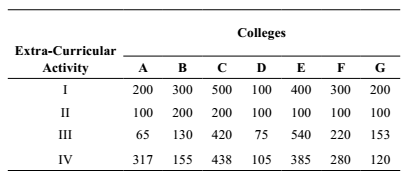
The ratio of total number of students in activity II and I is ?
802 060114773af82aa3010a2f6c5
60114773af82aa3010a2f6c5- 11 : 2false
- 29 : 20true
- 319 : 7false
- 421 : 10false
- Show Answer
- Workspace
- SingleChoice