Data Interpretation Questions Practice Question and Answer
8 Q:Directions: The bar graph given below shows the production (in ' 000 tones) of rice of a country for the year 2007 to 2011. Study the graph carefully and answer the question given below it.
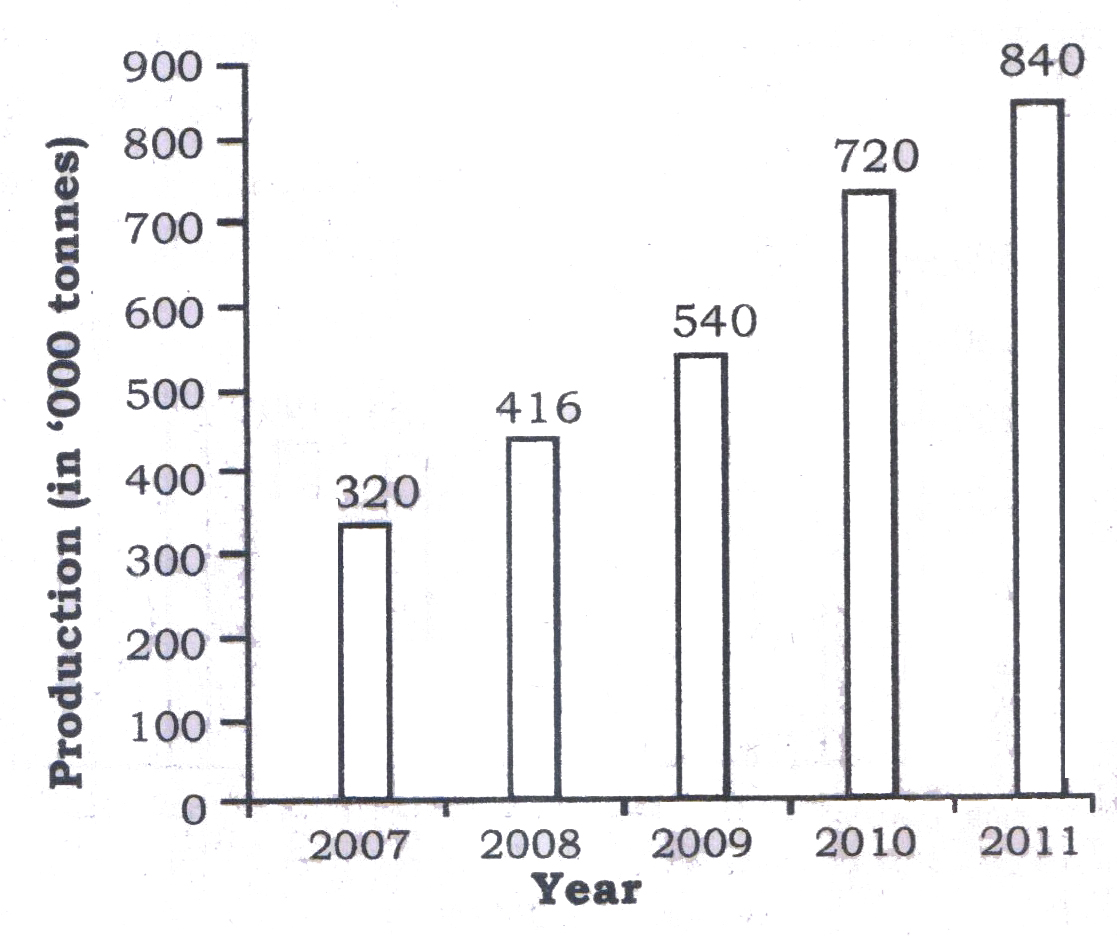
What is the average production of rice per year from 2009 to 2011? (in thousand tones)
847 05e81867ad56d695255db5622
5e81867ad56d695255db5622- 1700true
- 2550false
- 3860false
- 4900false
- Show Answer
- Workspace
- SingleChoice
Answer : 1. "700 "
Q:Study the following graph carefully to answer the given questions
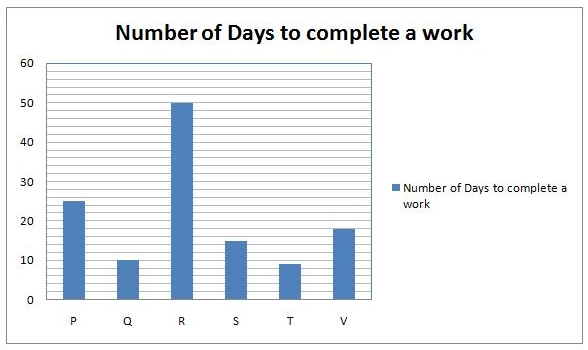
After working for 3 days S is joined by O. If they complete the remaining work in 3 more days, in how many days can O alone complete the work?
846 05ea9428a3dbbdc76195ae47f
5ea9428a3dbbdc76195ae47f- 110 daysfalse
- 28 daysfalse
- 35 daystrue
- 412 daysfalse
- 515 daysfalse
- Show Answer
- Workspace
- SingleChoice
Answer : 3. "5 days"
Q:Study the given graph and answer the question that follows.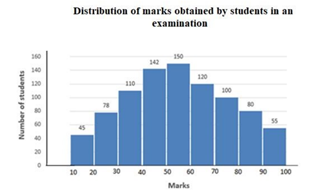
If 60% of the total number of students obtaining 50 marks or more but less than 70 marks are girls and 55 % of the total number of students obtaining 70 marks or more but less than 90 marks are also girls. Then the total number of girls obtaining 50 marks or more but less than 90 marks is:
845 0605326834999e13f2a6d25ae
605326834999e13f2a6d25ae- 1261true
- 2207false
- 3236false
- 4257false
- Show Answer
- Workspace
- SingleChoice
Answer : 1. "261"
Q:Direction: Study the following table carefully and answer the given questions. Table shows the of passed students in four schools and ratio between passed boys and girls among them. The ratio between failed boys and girls is reverse of passed ratio between them.
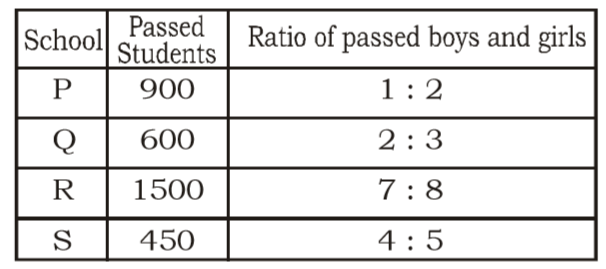
Find the approx average number of passed students in all the schools together.
842 05e9d34e0bf0a265d837bd778
5e9d34e0bf0a265d837bd778- 1873false
- 2843false
- 3833false
- 4863true
- 5853false
- Show Answer
- Workspace
- SingleChoice
Answer : 4. "863 "
Q:Directions: The bar graph shows the results of an annual examination in a secondary school in a certain year. Answer the following four questions based on this chart.

The ratio of the total number of boys passed to the total number of girls passed in the three classes VII, VIII and IX is
841 05e8afb7167af633f22bd755c
5e8afb7167af633f22bd755c- 119 : 25false
- 221 : 26false
- 320 : 23true
- 418 : 21false
- Show Answer
- Workspace
- SingleChoice
Answer : 3. "20 : 23"
Q: The bar chart given below shows the exports (in ₹000) and imports (in ₹000) of a country for 5 consecutive years.
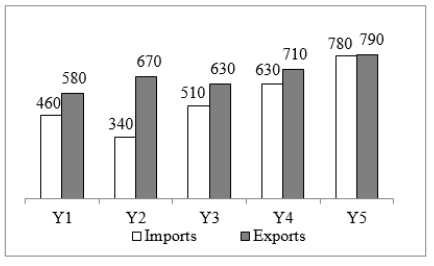
What is the positive difference in the total export figures of all the five years taken together and the total import figures of all the five years taken together?
841 06426dfdc7ac9a186e4de97d7
6426dfdc7ac9a186e4de97d7- 1₹6,20,000false
- 2₹5,40,000false
- 3₹5,80,000false
- 4₹6,60,000true
- Show Answer
- Workspace
- SingleChoice
Answer : 4. "₹6,60,000"
Q:Directions: Study the following table carefully to answer the questions that follow Number of Gold coins (in hundred) produced in Five Different companies during Six Different month.
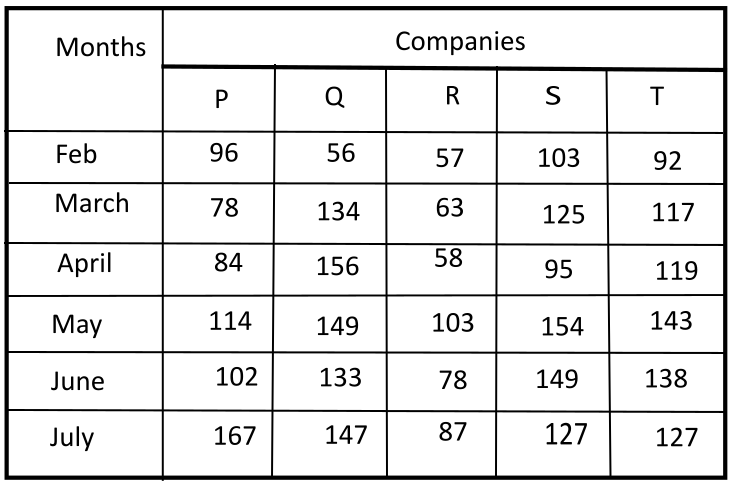
What was the total number of Gold coins produced from all the companies together in the month of march?
838 05fd9c7a489d4575ab490c20a
5fd9c7a489d4575ab490c20a- 153500false
- 251700true
- 35.15 thousandfalse
- 451500false
- 5None of thesefalse
- Show Answer
- Workspace
- SingleChoice
Answer : 2. "51700"
Q:Directions: Study the following table carefully to answer the questions that follow Number of Gold coins (in hundred) produced in Five Different companies during Six Different month.
Number of Gold coins produced from company R in the month May was approximately what percentage of the number of Gold coins produced in the company T in the month March?
838 05fd9c8b389d4575ab490d7db
5fd9c8b389d4575ab490d7db- 185true
- 295false
- 360false
- 440false
- 575false
- Show Answer
- Workspace
- SingleChoice