Data Interpretation Questions Practice Question and Answer
8 Q:Directions: Study the following table carefully to answer the questions that follow Number of Gold coins (in hundred) produced in Five Different companies during Six Different month.
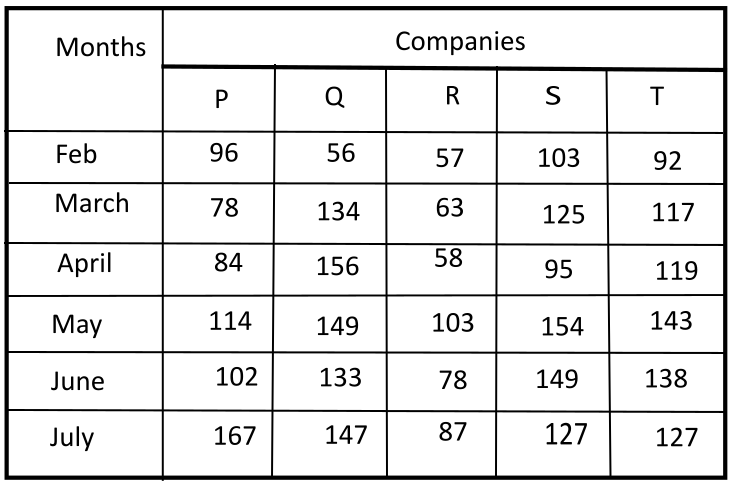
What was the respective ratio between the number of Gold coins produced from company P in the month may and the number of Gold coins produced from company T in the month June?
860 05fd9c743bc259a5735cb4d76
5fd9c743bc259a5735cb4d76- 138 : 41false
- 223 : 21true
- 319 : 21false
- 419 : 23false
- 5None of thesefalse
- Show Answer
- Workspace
- SingleChoice
Answer : 2. "23 : 21 "
Q:Study the given pie chart and answer the question that follows.
Distribution (Degree wise) of students studying in schools A, B, C, D and E
Total Number of students =9000
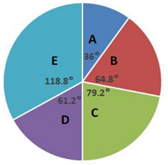
The number of students in School E exceeds the total number of students in school A and B by x, where x lies between:
856 060532b11a01bc44789ae80ef
60532b11a01bc44789ae80efDistribution (Degree wise) of students studying in schools A, B, C, D and E
Total Number of students =9000
- 1440 and 460true
- 2420 and 440false
- 3460 and 480false
- 4400 and 420false
- Show Answer
- Workspace
- SingleChoice
Answer : 1. "440 and 460"
Q:Directions : A graph showing the price of rice in India during the year 2000 to 2003 is given below. Study the graph carefully and answer the questions.

The month in which the price of rice were equal for the year 2000 and 2001 was
855 06391d80a58400a550dd8e0a8
6391d80a58400a550dd8e0a8- 1Septemberfalse
- 2Augustfalse
- 3Junetrue
- 4Novemberfalse
- Show Answer
- Workspace
- SingleChoice
Answer : 3. "June "
Q:The following penalty diagram shows the 4 year exam results of the students of 10th standard. Study the diagram and answer the following questions.
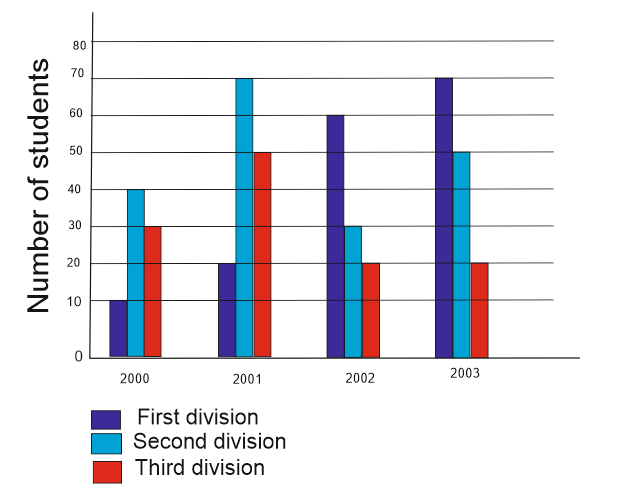
State the percentage increase in the first division in the year 2003 as compared to the year 2002:
853 05dd4deaca1c5834595c1342a
5dd4deaca1c5834595c1342a- 116%false
- 2true
- 345%false
- 455%false
- Show Answer
- Workspace
- SingleChoice
Answer : 2. "
Q:Study the following graph carefully to answer the given questions
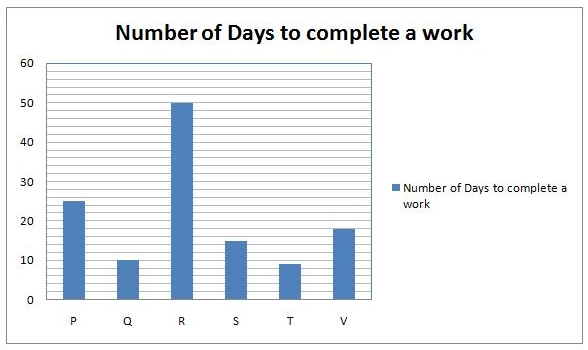
After working for 3 days S is joined by O. If they complete the remaining work in 3 more days, in how many days can O alone complete the work?
853 05ea9428a3dbbdc76195ae47f
5ea9428a3dbbdc76195ae47f- 110 daysfalse
- 28 daysfalse
- 35 daystrue
- 412 daysfalse
- 515 daysfalse
- Show Answer
- Workspace
- SingleChoice
Answer : 3. "5 days"
Q:Study the following graph carefully to answer the given questions
T and V started the work. After 3 days Z joined them, who can complete alone the same whole work in 3 days. What is the total number of days in which they had completed the work?
852 05ea94139f197950c155cbe11
5ea94139f197950c155cbe11- 112false
- 28false
- 34true
- 46false
- 5None of thesefalse
- Show Answer
- Workspace
- SingleChoice
Answer : 3. "4"
Q:Directions: The bar graph given below shows the production (in ' 000 tones) of rice of a country for the year 2007 to 2011. Study the graph carefully and answer the question given below it.
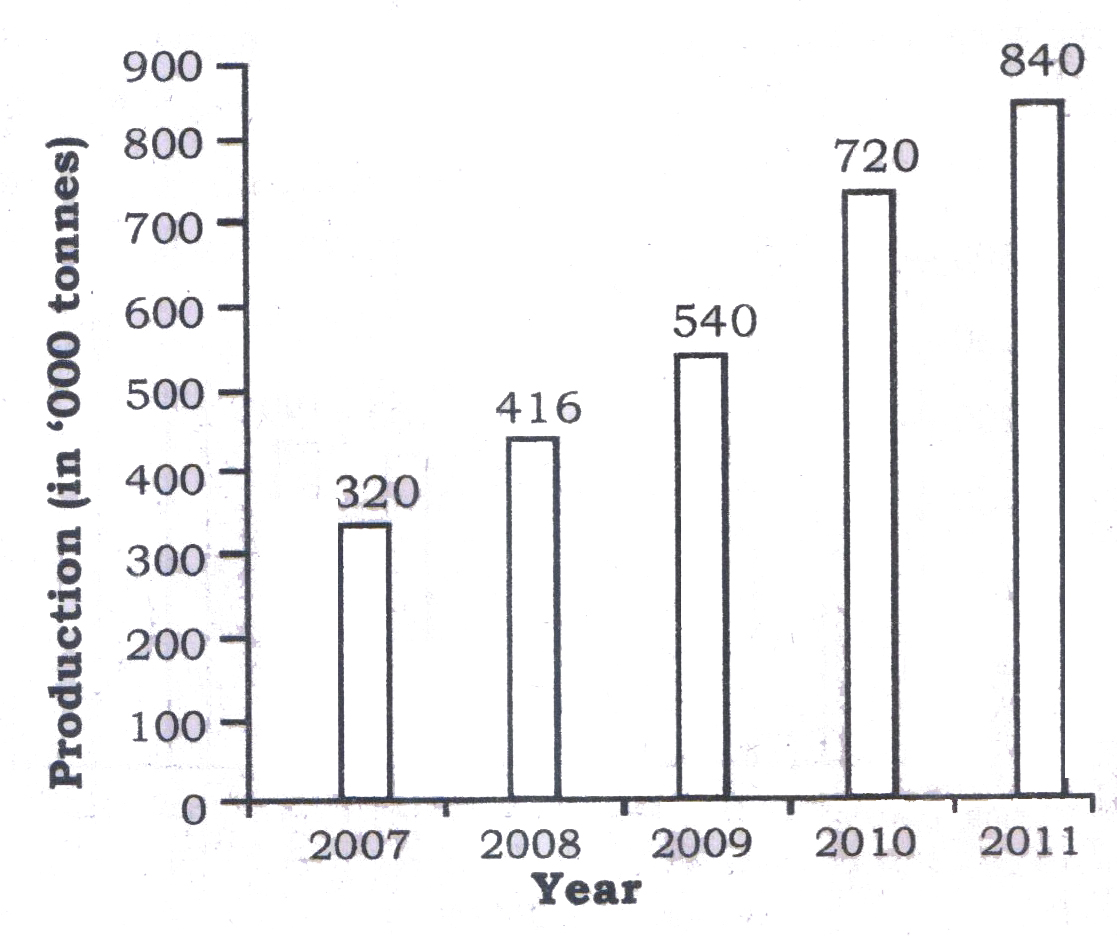
What is the average production of rice per year from 2009 to 2011? (in thousand tones)
852 05e81867ad56d695255db5622
5e81867ad56d695255db5622- 1700true
- 2550false
- 3860false
- 4900false
- Show Answer
- Workspace
- SingleChoice
Answer : 1. "700 "
Q:Study the following graph carefully to answer the given questions
A can do a piece of work 10 days more than that of Q. Both of them start the work but A leaves the work 5 days before its completion. Find the time in which work is completed.
851 05ea944063dbbdc76195aef12
5ea944063dbbdc76195aef12- 110true
- 215false
- 320false
- 425false
- 5None of thesefalse
- Show Answer
- Workspace
- SingleChoice