Data Interpretation Questions Practice Question and Answer
8 Q:Directions:Study the following table carefully to answer these questions:
Percentage of Marks obtained by six students in six subjects

What are the total marks obtained by ‘B’ in all the subjects together ?
1928 05e78a4a04572817353d44ba9
5e78a4a04572817353d44ba9- 1336false
- 2223false
- 3446false
- 4273false
- 5None of thesetrue
- Show Answer
- Workspace
- SingleChoice
Answer : 5. "None of these"
Q:Directions: The bar graph, given here, shows the number of tickets sold by 6 students A, B, C, D, E and F during a fair.
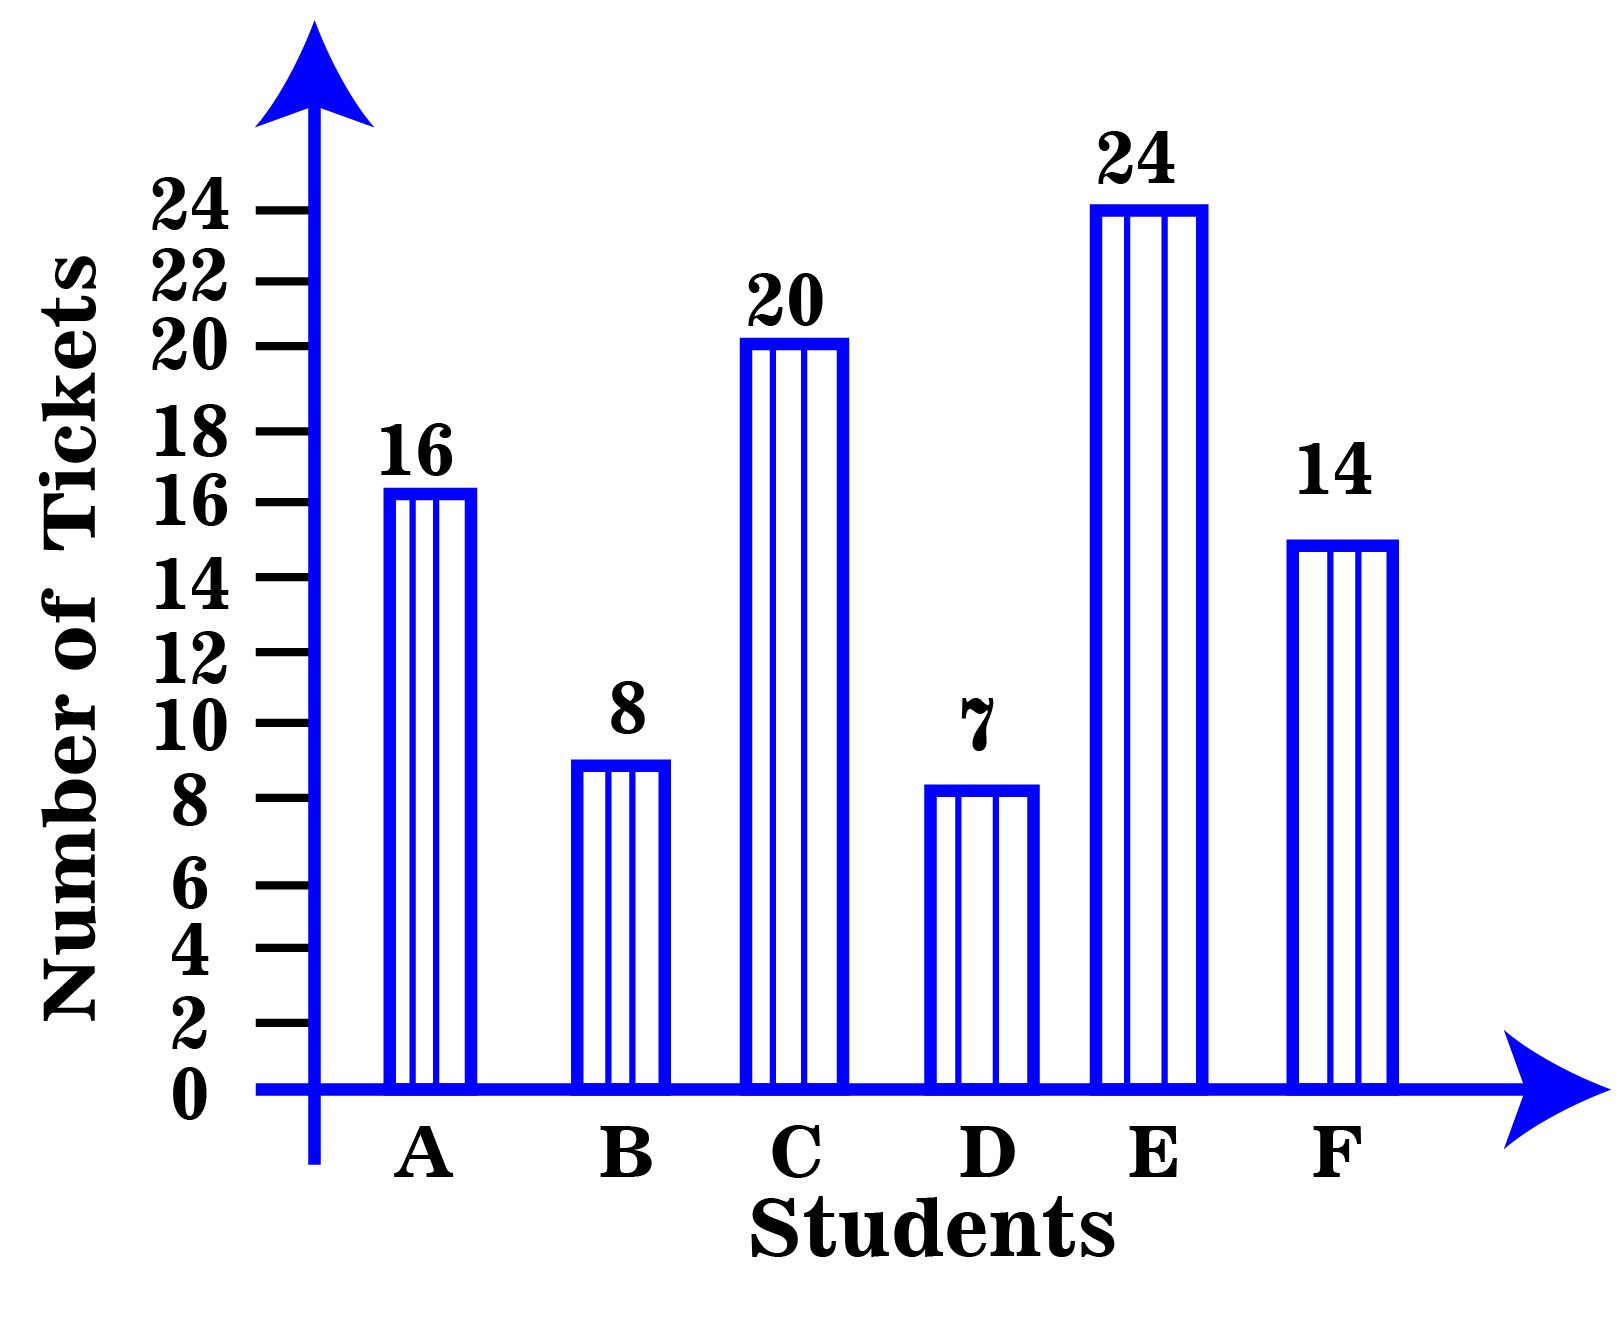
Total number of tickets sold by A, B and C is
1925 05ea81363a63dac4c26cbd00d
5ea81363a63dac4c26cbd00d- 145false
- 244true
- 342false
- 440false
- 5None of thesefalse
- Show Answer
- Workspace
- SingleChoice
Answer : 2. "44 "
Q:The following line graph gives the percentage of the number of candidates who qualified an examination out of the total number of candidates who appeared for the examination over a period of seven years from 1994 to 2000.
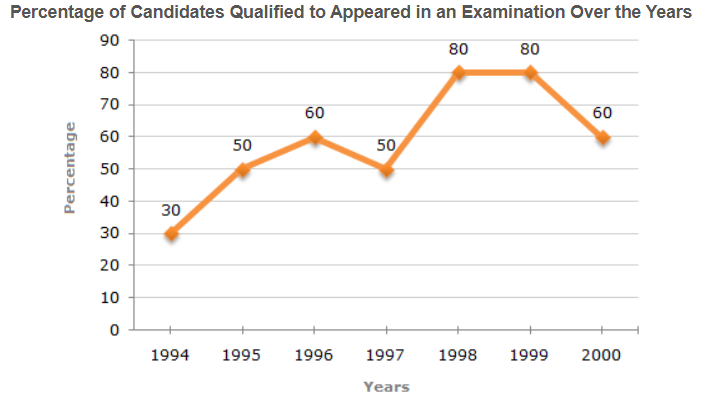
The total number of candidates qualified in 1999 and 2000 together was 33500 and the number of candidates appeared in 1999 was 26500. What was the number of candidates in 2000?
1895 05e799cbc8560ba13b02739f0
5e799cbc8560ba13b02739f0- 124500false
- 222000false
- 320500true
- 419000false
- 5None of thesefalse
- Show Answer
- Workspace
- SingleChoice
Answer : 3. "20500"
Q:Directions : Given line graph shows the data of male & female population in 5 different cities. Read the data carefully and answer the questions.
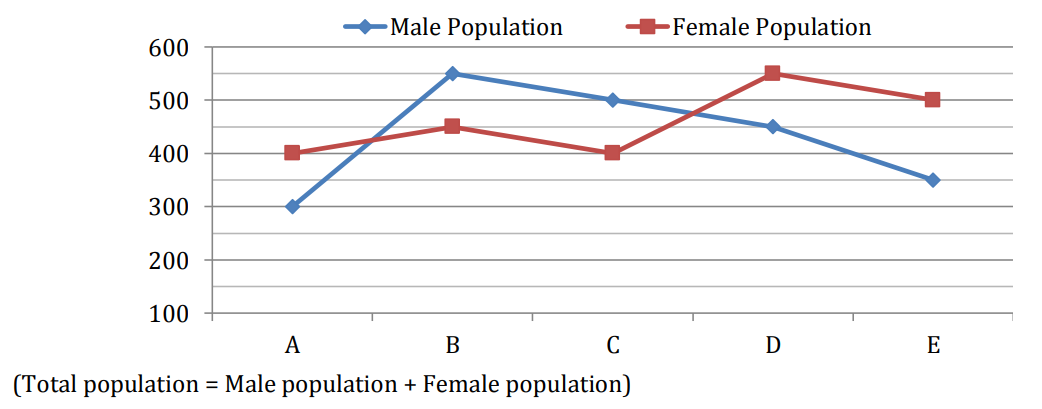
What percent of Female population in city C is male population in city E?
1886 0604088ff0634b252a6b984e6
604088ff0634b252a6b984e6- 190.2%false
- 287.5%true
- 384.5%false
- 485.5%false
- 5114.2%false
- Show Answer
- Workspace
- SingleChoice
Answer : 2. "87.5%"
Q:Directions : What will come in the place of the question mark (?) in the following number series?
5040, 840, 168, 42, 14, ? , 7
1863 05e93e5ea3d193e3bf6fdce54
5e93e5ea3d193e3bf6fdce54- 18false
- 29false
- 3None of thesefalse
- 47true
- 53false
- Show Answer
- Workspace
- SingleChoice
Answer : 4. "7"
Q:Direction: The line chart given below shows the number of labors (men and women) working in six different years. Study the data carefully and answer the following questions.
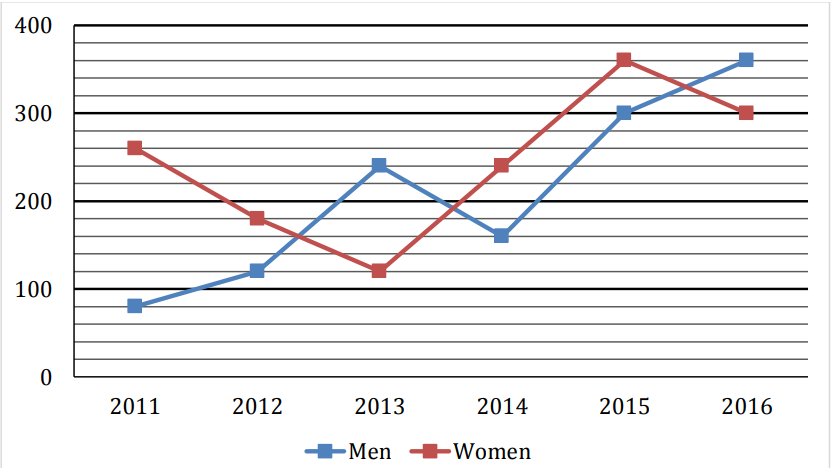
Find the ratio between total number of Labors working in 2012 and 2013 together to total number of labors working in 2015 and 2016 together?
1841 0603dcb36e759ac364c8ba37b
603dcb36e759ac364c8ba37b- 135 : 66false
- 211 : 10false
- 32 : 1false
- 41 : 2true
- 5None of the given optionsfalse
- Show Answer
- Workspace
- SingleChoice
Answer : 4. "1 : 2 "
Q:Directions:Study the following table carefully to answer these questions:
Percentage of Marks obtained by six students in six subjects
What are the average marks obtained by all the students in Maths ?
1818 05e78a0764572817353d4468f
5e78a0764572817353d4468f- 175false
- 2112.50true
- 3108.50false
- 478false
- 5None of thesefalse
- Show Answer
- Workspace
- SingleChoice
Answer : 2. "112.50 "
Q:Directions: The following pie-chart represents the result of 600 successful students in various subject of an examination. Study the Pie-chart and answer question.
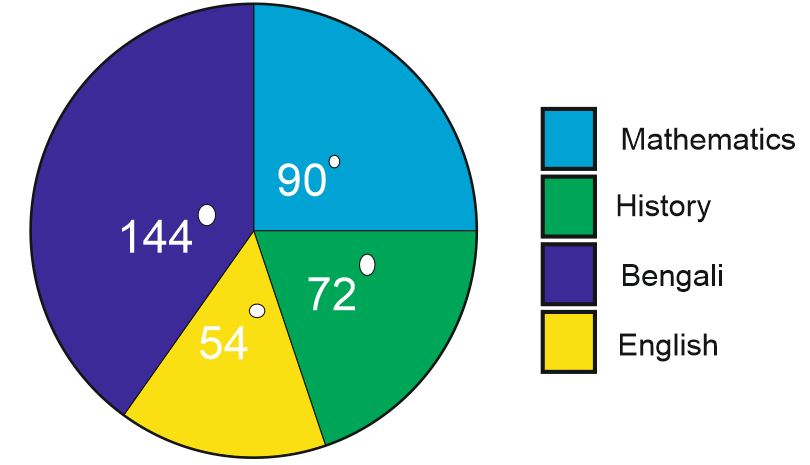
The percentage of students who passed in English is
1813 05ee3016e2bf4c40446491e93
5ee3016e2bf4c40446491e93- 115%true
- 220%false
- 35%false
- 412%false
- Show Answer
- Workspace
- SingleChoice