Data Interpretation Questions Practice Question and Answer
8 Q:Study the following table carefully and answer the questions given below.
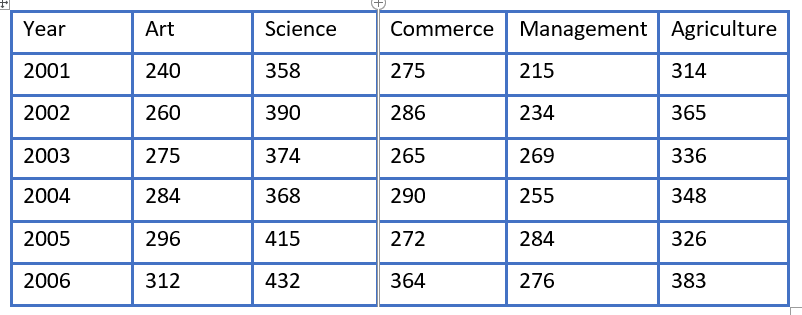
In which year the percentage change in the case of Agriculture discipline was highest from the previous year?
966 05da0511f31905d285336376e
5da0511f31905d285336376e- 12002false
- 22003false
- 32004false
- 42005false
- 52006true
- Show Answer
- Workspace
- SingleChoice
Answer : 5. "2006"
Q:Directions : The graph shows the demand and production of different companies. Study the graph and answer the following questions.
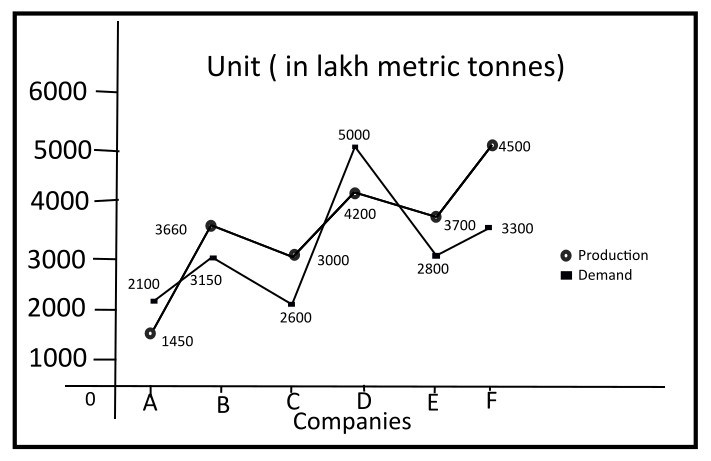
What is the second large demand company?
966 05f4f730882a7582d892c7ab9
5f4f730882a7582d892c7ab9- 1Ftrue
- 2Bfalse
- 3Afalse
- 4Dfalse
- Show Answer
- Workspace
- SingleChoice
Answer : 1. "F"
Q:Direction: The following graph shows the number of boys and girls in Class V, Class VI, Class VII and Class VIII. Study the graph and answer the question.
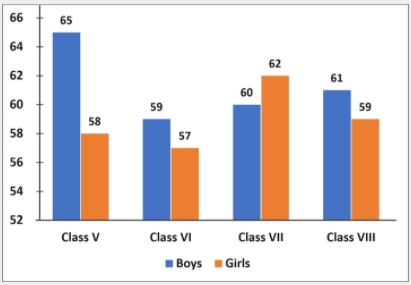
What is the average number of girls in all the classes?
963 0603751ac24cd273bc4f4abfb
603751ac24cd273bc4f4abfb- 161false
- 259true
- 354false
- 466false
- Show Answer
- Workspace
- SingleChoice
Answer : 2. "59"
Q:Direction: Study the following graph and answer the given question.
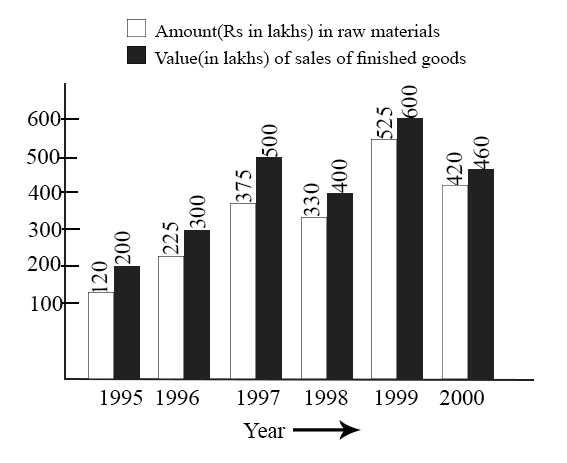
What was the difference between the average amount invested in raw materials during the given period and the average value of sales of finished goods during this period?
962 05d9daefa82ff737fd6a8362d
5d9daefa82ff737fd6a8362d- 1Rs. 62.5 lakhfalse
- 2Rs. 68.5 lakhfalse
- 3Rs. 71.5 lakhfalse
- 4Rs. 77.5 lakhtrue
- Show Answer
- Workspace
- SingleChoice
Answer : 4. "Rs. 77.5 lakh"
Q:The following penalty diagram shows the 4 year exam results of the students of 10th standard. Study the diagram and answer the following questions.
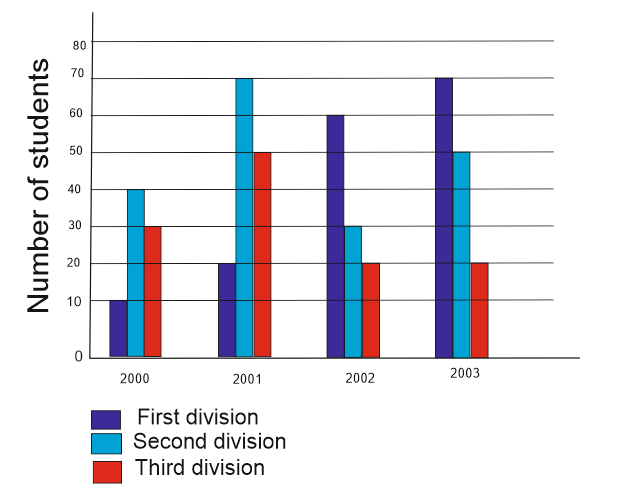
Name the number of students who appeared in the 10th standard examination in the year 2002-
960 05dd4de3cc2282c484e48c334
5dd4de3cc2282c484e48c334- 1110true
- 290false
- 380false
- 4120false
- Show Answer
- Workspace
- SingleChoice
Answer : 1. "110"
Q:A bar graph shows unit production and unit sold of the different type of mobile company A, B, C, D E and F. Study the bar graph and give the answer of following questions.
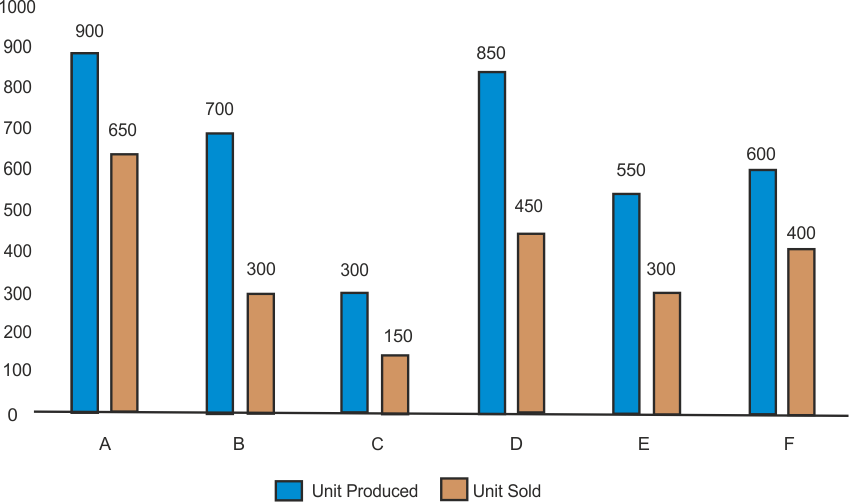
What is the difference between unit produced and unit sold of Mobile C Company?
959 05e213c7d5f8f8e395f9076f7
5e213c7d5f8f8e395f9076f7- 1150true
- 2300false
- 3650false
- 4120false
- Show Answer
- Workspace
- SingleChoice
Answer : 1. "150"
Q:Direction: Study the line graph carefully to answer the following questions.
Line graph shows the production (in thousand units) and percentage of exported mobiles, computers and laptops.
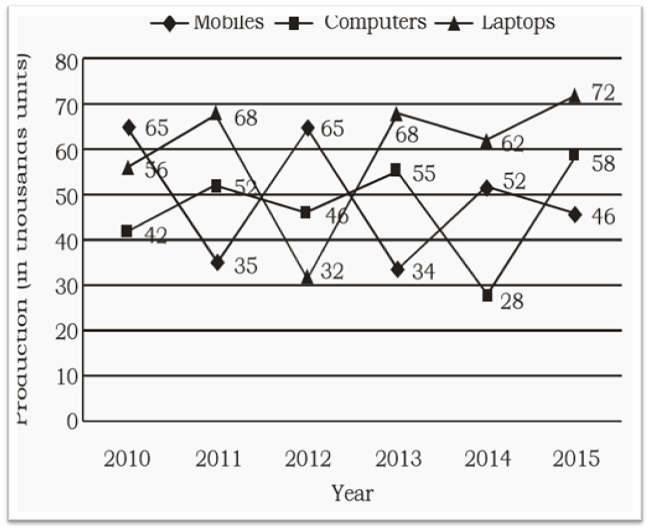
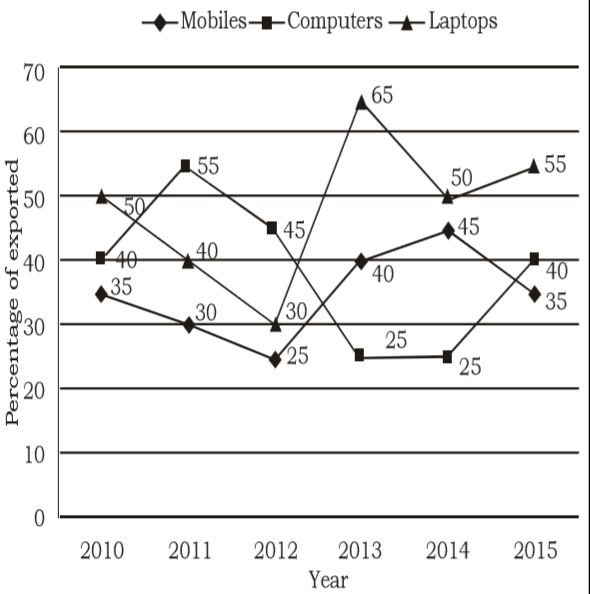
Find the ratio between Mobiles, Laptops and Computers exported in the year 2012.
958 05e9d1e23772f97276f50a277
5e9d1e23772f97276f50a277Line graph shows the production (in thousand units) and percentage of exported mobiles, computers and laptops.
- 1325 : 316: 419false
- 2325 : 192 : 414true
- 3319 : 216:425false
- 4256 : 355 : 135false
- 5None of thesefalse
- Show Answer
- Workspace
- SingleChoice
Answer : 2. "325 : 192 : 414"
Q:Direction: Study the following table carefully and answer the given questions. Table shows the of passed students in four schools and ratio between passed boys and girls among them. The ratio between failed boys and girls is reverse of passed ratio between them.
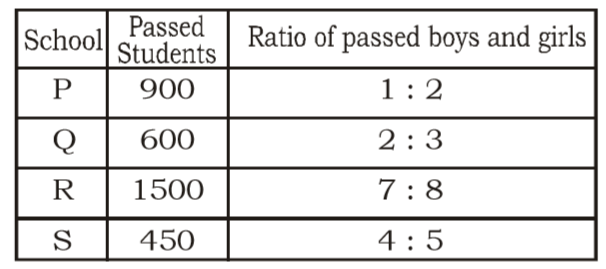
If in school P, 100 girls are failed in the exam, then find the total number of students in school P.
957 05e9d319c0a165a45b758541d
5e9d319c0a165a45b758541d- 11,100false
- 21,300false
- 31,200true
- 41,400false
- 51,500false
- Show Answer
- Workspace
- SingleChoice