Data Interpretation Questions Practice Question and Answer
8 Q:Directions : Given line graph shows the data of male & female population in 5 different cities. Read the data carefully and answer the questions.
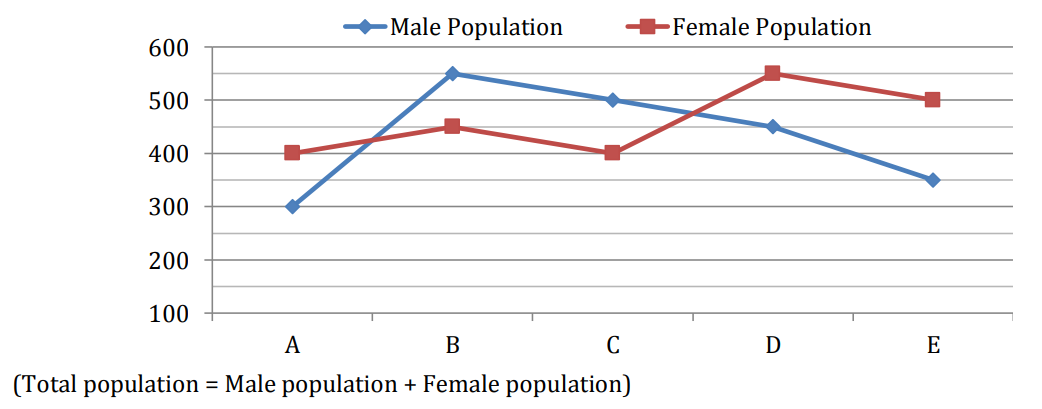
By what percent total population of city A is more or less than that of city D?
1120 060408744e759ac364c93e39d
60408744e759ac364c93e39d- 145%false
- 235%false
- 370%false
- 430%true
- 560%false
- Show Answer
- Workspace
- SingleChoice
Answer : 4. "30%"
Q:Study the following table carefully and answer the questions given below.
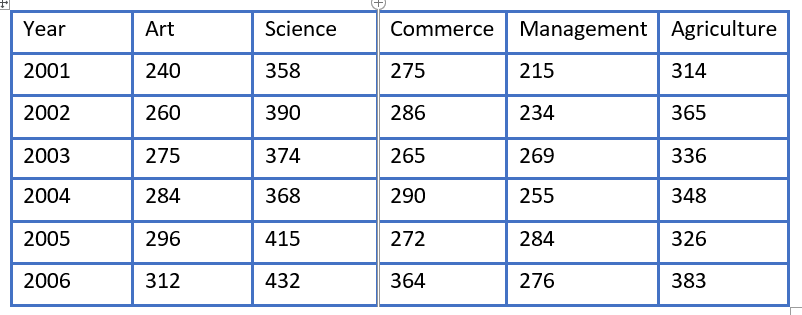
What was approximate percentage increase in the number of students in Commerce discipline from 2003 to 2004?
1114 05da051fd0ba8fe2a19c22b84
5da051fd0ba8fe2a19c22b84- 114false
- 218false
- 320false
- 49true
- 522false
- Show Answer
- Workspace
- SingleChoice
Answer : 4. "9"
Q:Directions: The bar graph given below shows the spending of family income on various items and savings during 1993. Observe the graph and answer the following questions:
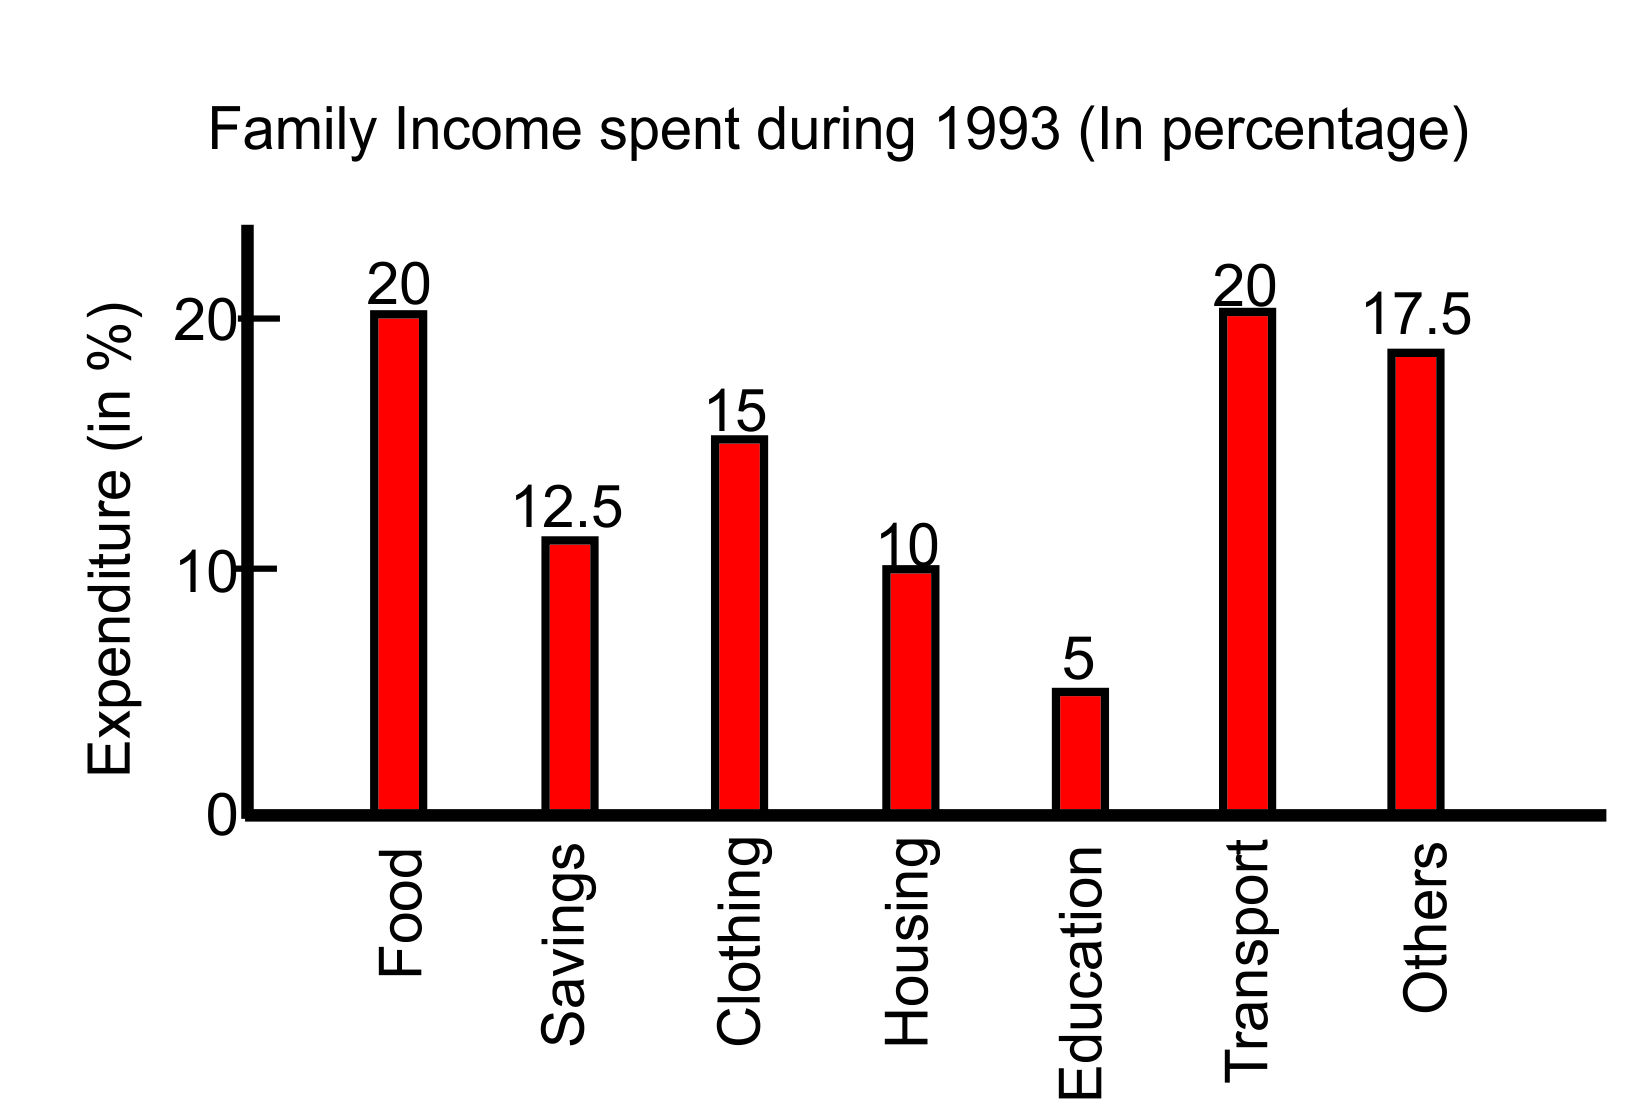
The total expenses of the family on transport is equal to those spent on:
1112 05def3eea806c5b05d54f2644
5def3eea806c5b05d54f2644- 1savingsfalse
- 2clothingfalse
- 3foodtrue
- 4othersfalse
- Show Answer
- Workspace
- SingleChoice
Answer : 3. "food "
Q:Comprehension: Read the following chart and answer the following questions.
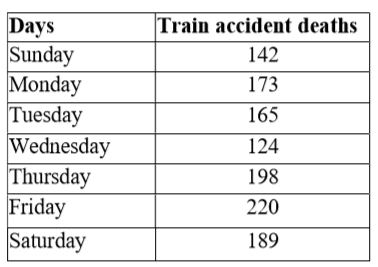
Which day of the week recorded maximum train accident deaths?
1111 05ebcc15c1126331540e94b6e
5ebcc15c1126331540e94b6e- 1Sundayfalse
- 2Thursdayfalse
- 3Fridaytrue
- 4Saturdayfalse
- Show Answer
- Workspace
- SingleChoice
Answer : 3. "Friday "
Q:Directions: Given table shows the data of population in 5 different parks. Study the data carefully and answer the questions.
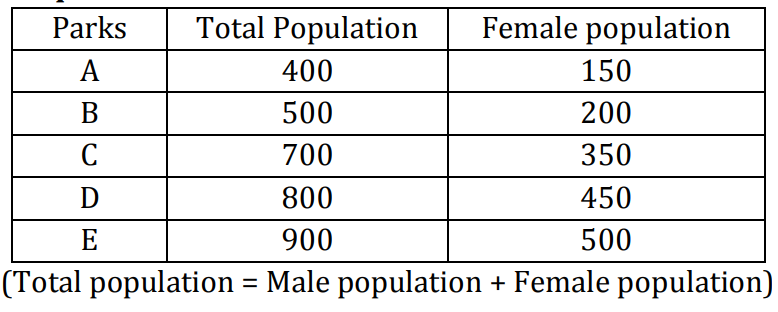
What is ratio of male population in park A & D together to female population in park B & E together?
1110 0603f61cc0634b252a6b662db
603f61cc0634b252a6b662db- 16 ∶ 7true
- 21 ∶ 1false
- 37 ∶ 6false
- 45 ∶ 6false
- 55 ∶ 7false
- Show Answer
- Workspace
- SingleChoice
Answer : 1. "6 ∶ 7"
Q:Direction: Study the following graph and answer the questions based on it.
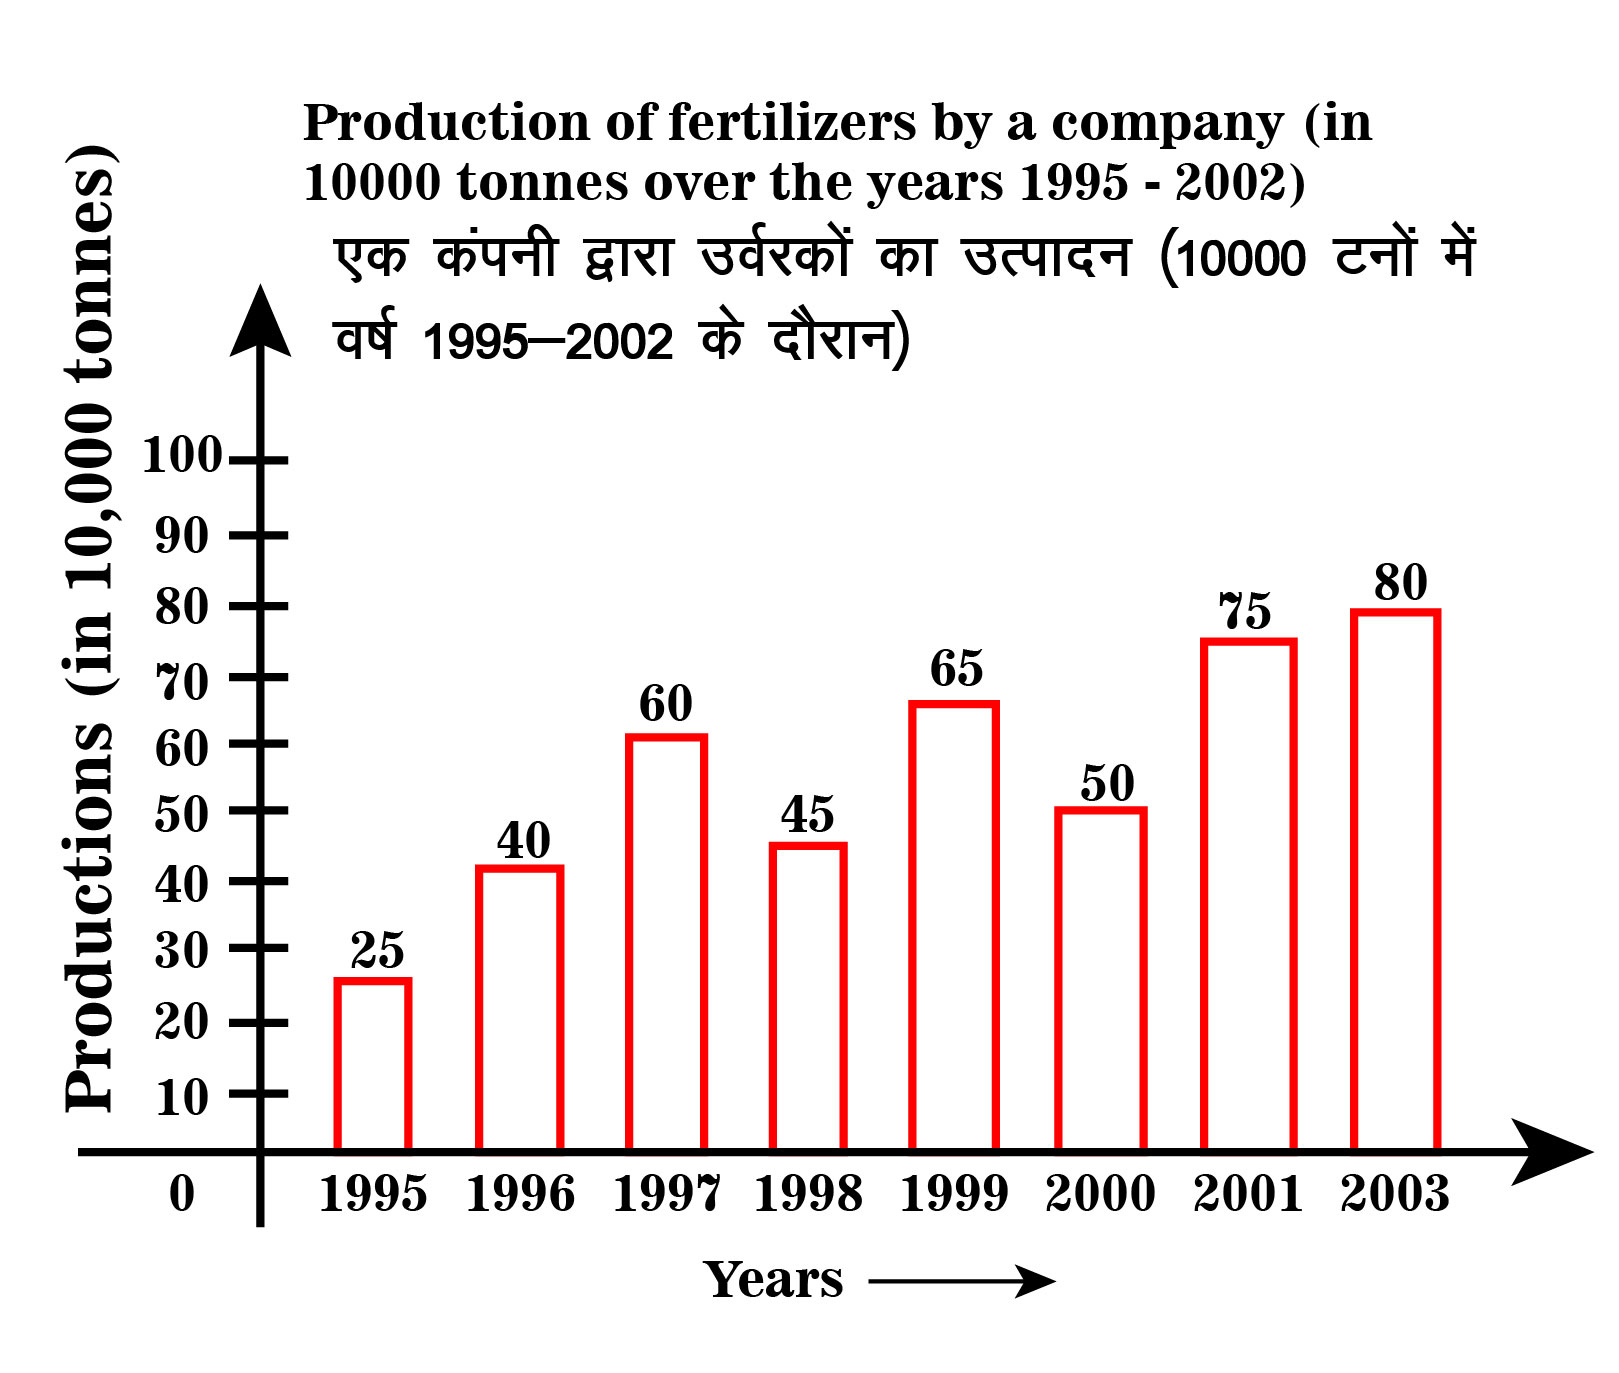
The ratio of total production of fertilizers in the year 1996 and 1997 to that of total production in the year 1995, 1998 and 2000 is
1109 05ea817103b50714be9b2441f
5ea817103b50714be9b2441f- 15 : 6true
- 26 : 5false
- 320 : 29false
- 413: 24false
- 5None of thesefalse
- Show Answer
- Workspace
- SingleChoice
Answer : 1. "5 : 6"
Q:Directions-Study the following diagram and answer the four questions.
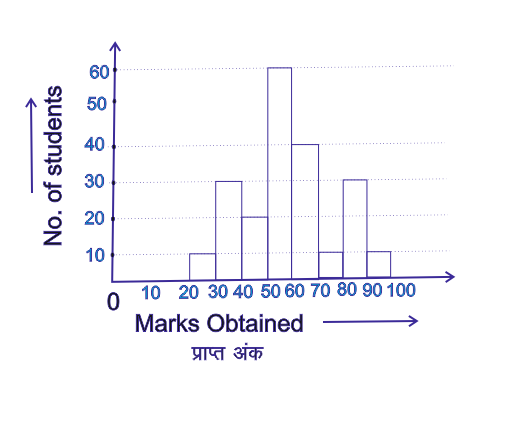
The total no. of students on whom this survey was made is
1107 05daea79bcca75847f4d932e8
5daea79bcca75847f4d932e8- 1190false
- 2200false
- 3220false
- 4210true
- Show Answer
- Workspace
- SingleChoice
Answer : 4. "210"
Q:Study the following bar chart and answer the questions carefully.
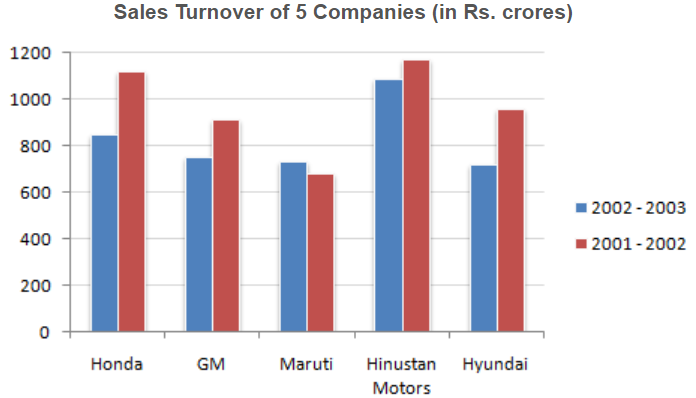
What should have been the sales turnover of GM in 2002 - 2003 to have shown an excess of the same quantum over 2001 - 2002 as shown by the sales turnover of Maruti ?
1104 05fd342d1eddcb86a7ee3e613
5fd342d1eddcb86a7ee3e613- 1953.76false
- 2963.76false
- 3952.76false
- 4962.76true
- 5None of thesefalse
- Show Answer
- Workspace
- SingleChoice